Download
1 / 26
260 likes | 271 Views
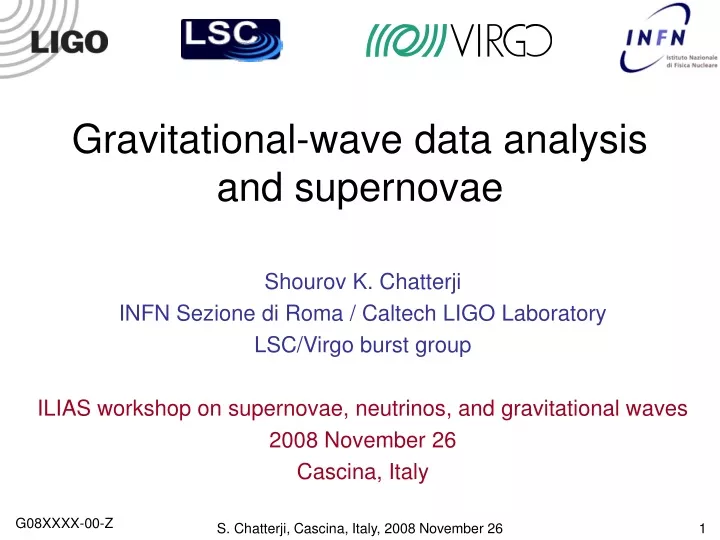
Gravitational-wave data analysis and supernovae. Shourov K. Chatterji INFN Sezione di Roma / Caltech LIGO Laboratory LSC/Virgo burst group ILIAS workshop on supernovae, neutrinos, and gravitational waves 2008 November 26 Cascina, Italy. Unmodeled burst search.

E N D
Gravitational-wave data analysis and supernovae Shourov K. Chatterji INFN Sezione di Roma / Caltech LIGO Laboratory LSC/Virgo burst group ILIAS workshop on supernovae, neutrinos, and gravitational waves 2008 November 26 Cascina, Italy S. Chatterji, Cascina, Italy, 2008 November 26
Unmodeled burst search • Signals lasting between ~1 millisecond and ~1 second • Signals in the frequency band from ~50 Hz to ~2+ kHz • Waveforms not sufficiently accurate or complete to permit a matched filter search • Search for statistically significant coincident events • Targeted sources • Asymmetric core collapse supernovae • Merger phase of binary compact objects* • Gamma ray burst progenitors • Neutron star instabilities • Cosmic string cusps* • The unexpected * Knowledge of waveforms also permits some matched filter searches S. Chatterji, Cascina, Italy, 2008 November 26
Unmodeled burst search (cont.) Gaussian pulse 235Hz Sine Gaussian 50M BBH merger Supernova ( from ZM catalog) 30 5 20 70 -5 -20 0 15 Time (ms) Time (ms) Time (ms) Time (ms) • “Eyes wide open” search philosophy • Make as few assumptions on signal as possible • Search as wide a parameter space as possible • Characterize performance on many sets of waveforms • Ad-hoc waveforms • Gaussians, sine-Gaussians, white noise bursts • Distributed over targeted signal space • Astrophysical waveforms • Supernovae, black hole merger simulation catalogs S. Chatterji, Cascina, Italy, 2008 November 26
Unmodeled burst search (cont.) • Typical approach is time-frequency “excess power” search: • Whiten data • Project whitened data onto basis covering target signal space • Threshold on projected magnitude to identify events with statistically significant excess signal energy • Cluster events that are nearby in signal space • Test for coincident events between multiple detectors • Test for signal consistency between multiple detectors • Evaluate false detection rate by time-shifting detector data • Evaluate sensitivity of search to isotropic populations for a variety of simulated waveforms • Eyes wide open approach leads to multiple choice of bases • Consider one such example search algorithm… S. Chatterji, Cascina, Italy, 2008 November 26
Example burst search • QPipeline is a multi-resolution time-frequency search method • Projects whitened data onto basis of sinusoidal Gaussians • Evaluated for a discrete set of highly overlapping basis functions spaced to constrain the signal loss due to mismatch • Equivalent to a templated matched filter search for waveforms that are sinusoidal Gaussians after whitening • Naturally yields tilings of thetime-frequency plane similarto dyadic wavelet transforms • The time-frequency plane istiled for multiple values of Q(frequency to bandwidth ratio) S. Chatterji, Cascina, Italy, 2008 November 26
Example burst search (cont.) S. Chatterji, Cascina, Italy, 2008 November 26
Example burst search (cont.) QPipeline view of simulated binary neutron star inspiral signal S. Chatterji, Cascina, Italy, 2008 November 26
Parameterization of bursts • Parameterization of bursts • Center time, center frequency, duration, and bandwidth • Characteristic amplitude at Earth • Matched filter signal to noise ratio, r0 • Order of magnitude energy estimates assuming isotropic emission and Gaussian enveloped sinusoidal waveforms • The detectability of supernovae waveforms can be quickly estimated using the above quantities and published search results S. Chatterji, Cascina, Italy, 2008 November 26
Sensitivity to supernovae • Simulated waveforms not sufficiently accurate or complete to permit matched filter search, but are useful to evaluate the sensitivity of the unmodeled burst search • Catalogs of simulated waveforms: Zwerger and Mueller; Dimmelmeier, Font, and Mueller; Ott and Burrows; more recent? • Waveform morphologies: core bounce, rotational instabilities, acoustic modes S. Chatterji, Cascina, Italy, 2008 November 26
Sensitivity to supernovae (cont.) • Detectable range depends on waveform morphology • Rough estimate from LIGO’s fourth science run (see Abbott, et al., Class. Qaunt. Grav. 24 (2007)): • Range at which half of supernovae would be detected • Assume isotropic distribution in direction and orientation • Range between 0.2 and 8 kpc, depending on waveform • Anticipate factor of ~2 increase in sensitivity for joint analysis of LIGO’s fifth science run and Virgo’s first science run • Detectable event rate is on the order of the galactic core-collapse supernovae rate of ~1 per 100 years for initial LIGO/Virgo. • C. D. Ott has estimated the optimal SNR for different supernovae waveform components and mechanisms… S. Chatterji, Cascina, Italy, 2008 November 26
Sensitivity to supernovae (cont). Optimal single detector SNR due to core bounce waveform component From C. D. Ott, 2008 November 25, CaJAGWR seminar S. Chatterji, Cascina, Italy, 2008 November 26
Sensitivity to supernovae (cont). Optimal single detector SNR due to core rotational instability waveform component From C. D. Ott, 2008 November 25, CaJAGWR seminar S. Chatterji, Cascina, Italy, 2008 November 26
Sensitivity to supernovae (cont). Optimal single detector SNR due to acoustic mechanism waveform component From C. D. Ott, 2008 November 25, CaJAGWR seminar S. Chatterji, Cascina, Italy, 2008 November 26
Supernovae targeted searches • Sensitivity of search limited by false detections • False detection rate depends on parameter space of search • May be able to do better than the eyes wide open burst search • How to narrow the parameter space? • “Externally triggered” search • Based on optical or neutrino observations observations • Known time of supernova • Search a limited window in time • Known position of supernova • Search a limited region on the sky • How much can optical and neutrino observations restrict the parameter space of the search? • Restrict space of waveforms • Search for waveforms with specific features • Optical follow-up of gravitational-wave triggers is also planned S. Chatterji, Cascina, Italy, 2008 November 26
Sky position recovery • A number of methods exist to estimate sky position • Timing based approaches use accurate measurements of the observed signal delay between pairs of detectors to triangulate the position on the sky • Coherent approaches also take into account the response of the detectors to both gravitational wave polarizations, and identify the regions of greatest likelihood on the sky • Bayesian coherent approaches determine a posteriori probability distributions for the source location on the sky • All of the approaches are currently being evaluated on simulated signals to determine the accuracy of position reconstruction • The goal is to have sky position estimation for interesting events within 10 to 30 minutes during the next joint science run starting in Spring of 2009 • Searches that target a single source on the sky are also planned S. Chatterji, Cascina, Italy, 2008 November 26
Time based position reconstruction Simulated recovery of sky position for 1 ms Gaussian pulses using LIGO/Virgonetwork using Gaussian matched filter search. Impulsive core collapse featureapproximated by short durationGaussian pulse. ~1 degree resolution F. Beauville, et al. Class.Quant.Grav. 25 (2008) S. Chatterji, Cascina, Italy, 2008 November 26
Coherent burst search • Full solution of the “inverse problem” requires three or more non-aligned detectors. • Data from two detectors can be used to predict the signal in the third detector • For each direction on the sky, use a linear combination of time shifted signals from two detectors to predict the signal in the third detector • Compute the prediction error • Find the direction on the sky where the prediction error is minimized • Yields best fit sky position • Also yields both polarizations of gravitational waveforms • This is equivalent to the maximum likelihood approach • Can be generalized to more than three detectors… S. Chatterji, Cascina, Italy, 2008 November 26
Coherent burst search (cont.) coherent null N-2 dimensionalnull space detector data coherent sum 2 dimensionalsignal space • Naturally handles arbitrary networks of detectors • Analysis repeated as a function of frequency and sky position • Produces significance and consistency sky maps Coherent sum: Find linear combinations ofdetector data that maximizesignal to noise ratio data = response x signal + noise Null sum: Linear combinations ofdetector data that cancelthe signal provide usefulconsistency tests. • Gursel and Tinto, PRD 40 (1989) 3884 • Klimenko, et al., PRD 72 (2005) 122002 • Rakhmanov, CQG 23 (2006) S673 • Wen and Schutz, CQG 22 (2005) S1321 • Chatterji, et al. PRD 74 (2006) 082005 S. Chatterji, Cascina, Italy, 2008 November 26
Collocated detectors • Special easy to understand case of coherent methods • Applicable to the two LIGO Hanford detectors • Subset of the general case • Produce hybrid ‘H’ detector than makes optimal use of H1 and H2 • Exhibits many of the same features as the general case • Optimal combination to maximize detectability • Null combination to test for consistency • But there are some differences • Coherent combinations are independent of source direction • Computationally much cheaper than general case • Cannot fully recover source information • Forms the first stage of a hierarchical coherent search S. Chatterji, Cascina, Italy, 2008 November 26
Collocated detectors example Simulated inspiral signal H1 H2 H+ yields ~10 percentincrease in SNR H- H+ H- consistent withdetector noise S. Chatterji, Cascina, Italy, 2008 November 26
Collocated detectors example (cont.) H1 H2 Coincident H1H2 glitch In time-shifted data set H- H+ Significant H- contentindicates inconstistency S. Chatterji, Cascina, Italy, 2008 November 26
Simulated consistency test Test the coherent null stream for consistency with detector noise as a function of sky position Color indicates c2 per degree of freedom of the coherent null sum as a function of sky position Interference fringes from combining signal in two detectors form rings along locus of constant time delay True source location at intersection of rings has c2 per degree of freedom of ~1 Figure from PRD 74 (2006) 082005 Simulated (A1B3G3) supernovae signal from Dimmelmeier et al. A&A 393 (2002) 523 Injected with SNR of 20 into simulated design sensitivity H1, L1, and V1 detector noise S. Chatterji, Cascina, Italy, 2008 November 26
Simulated consistency test (cont.) Consistency tests useful for distinguishing coincident detector glitches from real signals Detector glitches do not exhibit the ring features with reduced null sum energy that are observed for consistent signals Simulated gravitational-wave burst (consistent supernovae waveforms) Simulated coincident glitch (inconsistent supernovae waveforms) Color indicates fraction of available signal energy remaining in null stream Figures from PRD 74 (2006) 082005 Simulated (A1B3G3) supernovae signal from Dimmelmeier et al. A&A 393 (2002) 523 Injected into simulated design sensitivity H1, L1, and V1 detector noise S. Chatterji, Cascina, Italy, 2008 November 26
Simulated waveform recovery Given a best guess sky position, estimate the signal h from x = Fh + n by identifying the psuedo-inverse R such that RF = I. Simulated (A4B1G4) supernovae from Dimmelmeier et al. A&A 320 (1997) 209 Injected with SNR 40 into simulated H1, L1, and G1 detector noise Signal injected only into h+ polarization Recovered h+ signal (blue) is a noisy, band-passed version of the injected signal (red) Recovered hx signal (green) is just due to noise. S. Chatterji, Cascina, Italy, 2008 November 26
Restricting the siganl space • It is possible to decompose simulated supernovae waveform catalogs into minimal set of orthogonal waveforms • P. Brady and S. Ray-Majumder, Class. Qaunt. Grav 21 (2004) considered Gram-Schmidt orthogonalization • S. Heng, in preparation, arXiv:0810.5707v1, considers a principal component analysis decomposition • Used catalog from Dimmelmeier, et al. Phys. Rev. Lett 98 (2007) • Successfully reduced the catalog to ~10 orthogonal waveforms, indicating a good degree of similarity between the waveforms • The resulting basis can be used to construct a template bank for a more targeted search S. Chatterji, Cascina, Italy, 2008 November 26
Restricting the signal space (cont.) Number of waveforms required to achieve a specified worst case matchto all waveforms in the catalog S. Heng, in preparation, arXiv:0810.5707v1 S. Chatterji, Cascina, Italy, 2008 November 26