Download
1 / 36
370 likes | 483 Views
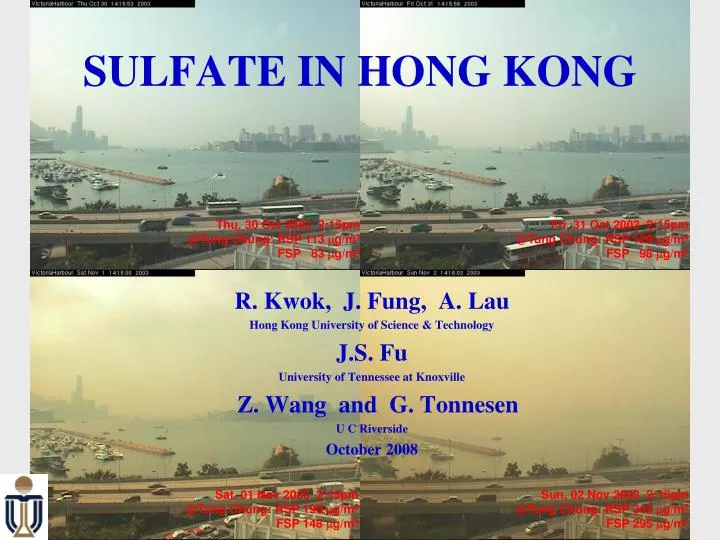
SULFATE IN HONG KONG. Thu, 30 Oct 2003 2:15pm @Tung Chung: RSP 113 m g/m 3 FSP 83 m g/m 3. Fri, 31 Oct 2003 2:15pm @Tung Chung: RSP 129 m g/m 3 FSP 98 m g/m 3. R. Kwok, J. Fung, A. Lau Hong Kong University of Science & Technology J.S. Fu University of Tennessee at Knoxville

E N D
SULFATE IN HONG KONG Thu, 30 Oct 2003 2:15pm @Tung Chung: RSP 113 mg/m3 FSP 83 mg/m3 Fri, 31 Oct 2003 2:15pm @Tung Chung: RSP 129 mg/m3 FSP 98 mg/m3 R. Kwok, J. Fung, A. Lau Hong Kong University of Science & Technology J.S. Fu University of Tennessee at Knoxville Z. Wang and G. Tonnesen U C Riverside October 2008 Sat, 01 Nov 2003 2:15pm @Tung Chung: RSP 190 mg/m3 FSP 148 mg/m3 Sun, 02 Nov 2003 2:15pm @Tung Chung: RSP 342 mg/m3 FSP 295 mg/m3
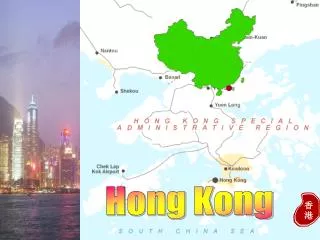
Pearl River Delta(PRD) Hong Kong
Monthly number of days with ( Visibility reporting < 8km & RH < 80% ) Visibility Report (11/1976 – 6/2004) Days / month Year
Visibility impairment associates with particulate matter (PM) level • Sulfate takes up 30% of total PM concentration Total PM10: 43.9 ug/m3
Questions • How much Hong Kong SO2, SO4 and EC are contributed from Hong Kong, PRD and beyond? • What are the major source types affecting Hong Kong SO2, SO4 and EC levels? Where from? • How do the pollutant levels vary from season to season?
MODELING SYSTEM MM5 v3.6 CMAQ v4.6 SMOKE 2.1
Meteorological model (MM5 v3.6) Physics Module • Long Wave Radiation option: RRTM scheme • Moisture option: Simple ice scheme • Surface Layer option: Monin-Obukhov scheme • Land Surface option: Noah land-surface model • Planetary boundary layer option: MRF scheme • Cumulus option: Grell scheme
HK prevailing background wind directions 2004 January April July October
EMISSIONS PRD SMOKEintoTRACE-P+BiogenicsSMOKE onMODIS
CMAQ 4.6 options • yamo advection • eddy vertical diffusion • CBIV mechanism • AE4 aerosol module • Aqueous chemistry
Obs-sim comparison • January, April, July, October 2004
January April SULFATE No observations Yuen Long, hourly observations July October
January April SO2 Yuen Long, hourly observations July October
January April OC OC EC EC Yuen Long, six-daily sampled meas. July October OC OC EC EC
A Way of Looking at Sulfate in Hong Kong....... Tagged Species Source Apportionment (TSSA) Developed by UC Riverside Modified CMAQ 4.5 with yamo and AE3
Tagged Species Source Apportionment • Tag species of interest in every region and every emission type. • Each grid cell records species concentrations from each tag. SrcA, Region1 SO2 SrcB, Region3 SO2 (I,J-1) (I,J+1) (I,J) SrcC from Region1 SrcB from Region3 SrcA from Region1
Species to tag: SO2, SO4, EC Require to split • Emission categories • Emission regions
5 Emission Categories • Point Source (Mostly Power Plants) PT • Marine Source (Local Ferry, Riverboat, Ocean-going ships) OF • Industrial Source AR • On-road Moving Vehicular Source MV • Other Anthropogenic/Biogenic Source FW
SO2 Emis Point Marine Indust. Others On-road
Apart from Emission Categories.... Also Need to TagNon-emission contributors..... InitialandBoundaryConditions
SO2 in Hong Kong BCON HK
Sulfate in Hong Kong BCON HK
EC in Hong Kong BCON HK
Summary – HK SO2 Point sources from Hong Kong and Shenzhen Marine sources from HK, PRD waters, Shenzhen
Summary – HK Sulfate Point sources from Hong Kong and Shenzhen Marine sources from HK, PRD waters, Shenzhen
Summary – HK Elemental Carbon Vehicle sources from Hong Kong and Shenzhen
Further Work • Apply TSSA to a bigger grid covering Guangdong • Find out the extent of super-regional effects • Decide emission control strategy based on TSSA results
ACKNOWLEDGMENT • University Grant Committee of Hong Kong RTG08/09.SC001 • University Grant Committee of Hong Kong RGC612807