Download
1 / 23
230 likes | 370 Views
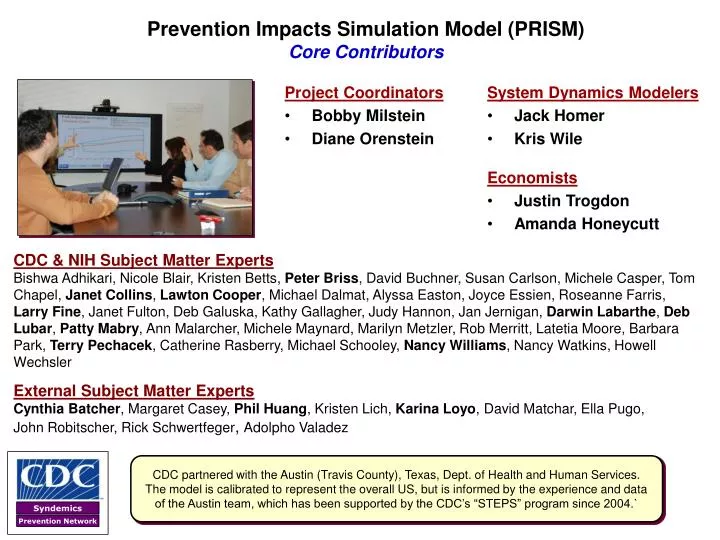
Prevention Impacts Simulation Model (PRISM) Core Contributors. Project Coordinators Bobby Milstein Diane Orenstein. System Dynamics Modelers Jack Homer Kris Wile. Economists Justin Trogdon Amanda Honeycutt.

E N D
Prevention Impacts Simulation Model (PRISM)Core Contributors Project Coordinators • Bobby Milstein • Diane Orenstein System Dynamics Modelers • Jack Homer • Kris Wile Economists • Justin Trogdon • Amanda Honeycutt CDC & NIH Subject Matter ExpertsBishwa Adhikari, Nicole Blair, Kristen Betts, Peter Briss, David Buchner, Susan Carlson, Michele Casper, Tom Chapel, Janet Collins, Lawton Cooper, Michael Dalmat, Alyssa Easton, Joyce Essien, Roseanne Farris, Larry Fine, Janet Fulton, Deb Galuska, Kathy Gallagher, Judy Hannon, Jan Jernigan, Darwin Labarthe, Deb Lubar, Patty Mabry, Ann Malarcher, Michele Maynard, Marilyn Metzler, Rob Merritt, Latetia Moore, Barbara Park, Terry Pechacek, Catherine Rasberry, Michael Schooley, Nancy Williams, Nancy Watkins, Howell Wechsler External Subject Matter ExpertsCynthia Batcher, Margaret Casey, Phil Huang, Kristen Lich, Karina Loyo, David Matchar, Ella Pugo, John Robitscher, Rick Schwertfeger, Adolpho Valadez CDC partnered with the Austin (Travis County), Texas, Dept. of Health and Human Services. The model is calibrated to represent the overall US, but is informed by the experience and data of the Austin team, which has been supported by the CDC’s “STEPS” program since 2004.`
Prevention Impacts Simulation Model (PRISM) Represents multiple interacting risks and interventions for heart disease, stroke, and related chronic diseases: medical, behavioral, social, environmental Begun in 2007 (now version 2i) and it remains a work-in-progress Engaged subject matter experts from 12 organizations (N~30), and 100s of policy officials, including a deep collaboration with local leaders in Austin, Texas Integrates best available information in a single testable model to support prospective planning and evaluation Explores the likely effects of “local interventions” (i.e., changes in local options/exposures/services that affect behavior and/or health status) To what extent might adverse events and costs be reduced? How can policymakers balance interventions for best effect with limited resources? References: Homer J, Milstein B, Wile K, Trogdon J, Huang P, Labarthe D, Orenstein D. Simulating and evaluating local interventions to improve cardiovascular health. Preventing Chronic Disease, 2009 (in press). Homer J, Milstein B, Wile K, Pratibhu P, Farris R, Orenstein D. Modeling the local dynamics of cardiovascular health: risk factors, context, and capacity. Preventing Chronic Disease 2008;5(2). Available at <http://www.cdc.gov/pcd/issues/2008/apr/07_0230.htm
The Popular (and Professional) View of Chronic Disease Challenges is Largely One Headline after Another JunkFood Tobacco PhysicalActivity Obesity Heart Disease & Stroke Cancer Air Pollution WeightLoss Diabetes Healthy Food Health CareCost Stress Sodium MentalHealthServices BloodPressure Alcohol Trans fat PrimaryCare Cholesterol Sleep Emergency & Rehab Care Arthritis
PRISM Situates Multiple Medical, Behavioral, and Environmental Factors into a Single Set of Causal Pathways
PRISM Situates Multiple Medical, Behavioral, and Environmental Factors into a Single Set of Causal Pathways
PRISM Also Includes Frontiers for Social Action TOBACCO Reduce air Weight loss Ban smoking in Tax, restrict sales/mktg, pollution services for obese counter-marketing, public places quit services JUNK FOOD Tax, restrict sales/mktg, counter-marketing HEART-HEALTHY FOOD Access, promotion Sodium in food PHYSICAL ACTIVITY Access, promotion, social support, school recs, childcare recs Quality of acute Help services Trans fat Quality and use of and rehab care for distress In food preventive care Local Context for Weight Loss Services Local Context for Tobacco Local Context for Diet Local Context for Physical Activity Local Context for Air Pollution Local Context for Health Care Services Local Context for Mental Health Services Secondhand Air pollution Obesity Smoking Excess exposure smoke calorie diet (PM 2.5) Other deaths and costs attributable to risk factors, and costs of risk factor Heart- management unhealthy diet Chronic Disorders -Hypertension Uncontrolled Cardiovascular Total consequence -High cholesterol chronic disorders Excess events costs -Diabetes sodium diet CVD deaths, disability, Use of quality and costs Physical preventive care inactivity Trans fat Distress consumption
Primary Information Sources Census Population, deaths, births, net immigration American Heart Association & NIH statistical reports Cardiovascular events, deaths, and prevalence National Health and Nutrition Examination Survey (NHANES) Risk factor prevalence by age and sex Diagnosis and control of hypertension, high cholesterol, and diabetes Medical Examination Panel (MEPS), National Health Interview (NHIS), Behavioral Risk Factor Surveillance System (BRFSS), Youth Risk Behavior Survey (YRBS) Medical and productivity costs attributable to risk factors Prevalence of distress in non-CVD and post-CVD populations Primary care utilization Extent of physical activity Research literature CVD risk calculator (Framingham) Relative risks from secondhand smoke, air pollution, obesity, poor diet, inactivity, distress Quality of diet (USDA Healthy Eating Index) Medical and productivity costs of cardiovascular events Effect sizes of behavioral interventions Expert judgment Effect sizes of behavioral interventions Uncertainties are assessed through sensitivity testing
Mapping Information SourcesPhysical Activity Pathway • Physical Inactivity Prevalence52% - 65% (by age) • NHANES, BRFSS, & YRBS • Troiano RP, et al. Med Sci Sports Ex 2008; 40(1):181-188.
Mapping Information SourcesPhysical Activity Pathway • Effective Interventions Increase PA by 40-55% (by age and strategy) • Kahn EB, et al. Am J Prev Med 2002; 22:S73-102.
Mapping Information SourcesPhysical Activity Pathway • RR for obesity onset = 2.6 • Haapanen N, et al. Intl J Obesity 1997: 21:288-296
Mapping Information SourcesPhysical Activity Pathway • RR for distress = 1.3 • Netz Y, Wu M-J, et al. Psyh Aging 2005; 20(2):272-284. .
Mapping Information SourcesPhysical Activity Pathway • RR of inactivity if distressed: 1.6 • Whooley MA, et al. JAMA 2008; 300(20):2379-2388.
Mapping Information SourcesPhysical Activity Pathway • RR for High BP = 1.15RR for High Cholesterol = 1.4 • RR for Diabetes = 1.4 • Ann Med 1991;23(3):319–327. • Intl J Epidemiology 1997; 26(4):739-747. • Canadian Med Assoc J 2000;163(11):1435-1440. • Lancet 1991; 339:778-783. • Arch Intern Med 2001; 161:1542-1548.
Mapping Information SourcesPhysical Activity Pathway • Modification of theFramingham Risk Calculator • Ex Rev Pharm Out Res 2006;6(4):417-24. • Am Heart J 1991;121(1 Pt 2):293-8. • Am Heart J 2007;153(5):722-31, 31 e1-8. • JAMA 2001;286(2):180-7.
Base Case & Illustrative Intervention Scenarios Base Case (a simple scenario for comparison) • Assume no further changes in the contextual factors that affect risk factor prevalences • Any changes in prevalences after 2004 are due to “inflow/outflow” adjustment process and population aging • Result: Past trends level off after 2004, after which results reflect only slow adjustments in risk factors • Increasing obesity, high BP, and diabetes • Decreasing smoking • Increases in risk factors and population aging lead to eventual rebound in attributable deaths Example Intervention Scenarios (max plausible effects, sustained) • Four clusters of interventions layered to show their partial contribution and combined effects • Services (health care, weight loss, smoking quit, distress)+ Diet & Physical Activity+Tobacco +Air Pollution & Sodium & Trans fat
Illustrative Intervention Scenarios: Maximum Plausible StrengthIndividual Services + Diet & PA +Tobacco +Air Pollution & Sodium & Trans fat Smoking Prevalence (Adults) Obesity Prevalence (Adults) Draft Model Output Draft Model Output 0.4 0.4 0.3 0.3 0.2 0.2 0.1 0.1 0 0 1990 2000 2010 2020 2030 2040 1990 2000 2010 2020 2030 2040 Cardiovascular Events per 1000(CHD, Stroke, CHF, PAD) Deaths from All Risk Factors per 1,000 30 Draft Model Output Draft Model Output 8 22.5 6 15 4 7.5 2 0 0 1990 2000 2010 2020 2030 2040 1990 2000 2010 2020 2030 2040 **if all risk factors=0** Work in Progress, Please do no cite or distribute.
Illustrative Intervention Scenarios: Maximum Plausible StrengthIndividual Services + Diet & PA +Tobacco +Air Pollution & Sodium & Trans fat Years of Life Lost from Attributable Deaths Consequence Costs per Capita (medical costs + productivity) 30 M 6,000 Draft Model Output Draft Model Output 22.5 M 4,500 15 M 3,000 7.5 M 1,500 0 0 1990 2000 2010 2020 2030 2040 1990 2000 2010 2020 2030 2040 **if all risk factors=0** Work in Progress, Please do no cite or distribute.
Example of Sensitivity TestingEstimated impacts of a 15-component intervention, with uncertainty ranges Total Consequence Costs per capita (2005 dollars per year) Deaths from CVD per 1000 3,000 4 Base Case Base Case 2,000 2 Combined 15 interventions with range of uncertainty Combined 15 interventions with range of uncertainty 1,000 Costs if all risk factors = 0 Deaths if all risk factors = 0 Model Output (v2008) Model Output (v2008) 0 0 1990 2000 2010 2020 2030 2040 1990 2000 2010 2020 2040 2030 Homer J, Milstein B, Wile K, Trogdon J, Huang P, Labarthe D, Orenstein D. Simulating and evaluating local interventions to improve cardiovascular health. Preventing Chronic Disease, 2009 (in press).
How are Practitioners Using PRISM? Users (~500) Customized Versions • East Austin, Texas • Mississippi Delta • New Zealand Ministry of Health • U.S. economic stimulus health initiative Nat’l & State Stakeholders • CDC Staff • National Association of Chronic Disease Directors • Directors of Public Health Education • National Institutes of Health (NHLBI, OBSSR) A Few Local Versions • Re-calibrate to areas with different demographics, histories, and current conditions Planning • Engage a wider circle of stakeholders • Situate silos within a system • Prioritize interventions (given tradeoffs/synergies) • Set plausible short- and long-term goals Evaluating • Trace intervention effects through direct, secondary, and summary measures • Extend the time horizon for evaluative inquiry • Establish novel referents for comparison (self-referential counter-factuals)
Conversations Around the Model STRATEGIC PRIORITIES • What’s in the model does not define what’s in the room • Simulations intentionally raise questions to spark broader thinking and judgment • Narrower boundaries tend to be more empirically grounded • Wider boundaries may legitimize “invisible” processes • Boundary judgments follow from the intended purpose and users Local intervention opportunities and costs Other health priorities Community themes and strengths SYSTEM DYNAMICS MODEL Political will Stakeholder relationships Health inequities Researchagenda Available information
Interactive ModelingBuilds Foresight, Experience, and Motivation to Act Expert Recommendations Experiential Learning “Wayfinding”