Download

1 / 31
320 likes | 586 Views
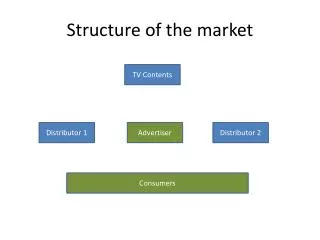
Market Structure and the Behavior of Firms. Market Structures. Benchmark models Perfect Competition Monopoly. Behavior of Firms. What is the objective of a business? Maximize profit = TR – TC . TR = Total Revenue = Pq TC = Total Economic Costs.

E N D
Market Structures • Benchmark models • Perfect Competition • Monopoly
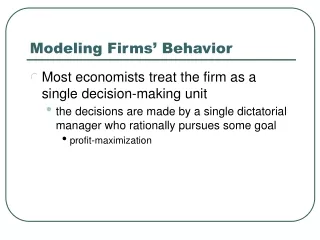
Behavior of Firms • What is the objective of a business? • Maximize profit = TR – TC TR = Total Revenue = Pq TC = Total Economic Costs Economic Cost = Explicit Cost + Implicit Cost
Suppose that a young chef opened his own restaurant. To do so, he quit his job, which was paying $36,000 per year; cashed in a $6,000 certificate of deposit that was yielding 5% (to purchase equipment); and took over a building owned by his wife which had been rented out for $3,000 per month. His expenses for the first year amounted to $60,000 for food, $40,000 for extra help, and $7,000 for utilities. The chef is trying to figure out whether he would have been better off not being in business last year. He knows how to calculate his revenues, but he needs help with the cost side of the picture. What were the chef's total economic costs? • $107,000 • $113,000 • $149,000 • $185,300 $60,000 (food) $36,000 (foregone job) $40,000 (extra help) $300 (foregone interest) $7,000 (utilities) $36,000 (foregone rent) $6,000 (equipment) $113,000 $72,300 Total Economic Cost = $185,300
Technological Constraints • Production Function q = F(L, K) _ q = output L = labor K = capital F(·) represents technology Variable input Fixed input Lab Experiment 3: Widget Production
Other measures of productivity • Average Product AP = q/L • Marginal Product MP = Δq/ ΔL Note: Diminishing Marginal Returns (DMR) When there is at least one fixed input, eventually a point is reached at which the marginal product of an additional worker begins to fall.
Productivity Graphs DMR output Slope = MPL = ∆q/ ∆L q/L ∆q TP ∆L AP labor L1 L2 labor L1 L2 MP
Measuring Marginal Product • Batting Averages • GPAs 4.0 2.0 3.0 3.0 3.5 3.125 When MP > AP then AP will rise When MP < AP then AP will fall
Which worker at Decent Donuts has the highest marginal product? • The fourth • The fifth • The sixth • The seventh
Short Run Costs TC = FC + VC • Does not vary with output: • Rent • Utilities • Salaries • Property taxes • Insurance premiums • Varies with output: • Labor • Raw materials
Short Run Cost Curve Family TC $ VC $ MC ATC AVC FC AFC output output TC = FC + VC ATC = AFC + AVC
Which of the following would be classified as a variable cost for the local Texaco gasoline station? • interest payments to a local bank for a loan. • the local property tax on the building owned by the Texaco operator. • the premiums paid for liability insurance, which are fixed at about $30,000 per year. • the federal excise tax paid on each gallon of Texaco gasoline sold.
Oscar has negotiated a lease for his sporting goods store where he is required to pay $2,500 per month in rent. Oscar pays his staff $9 per hour to sell sporting goods and his monthly electricity bill averages $700, depending on his total hours of operation. Oscar's fixed costs of production equal: • $2,500 per month. • $3,200 per month. • $9 per hour multiplied by total hours of work plus $700. • $9 per hour multiplied by total hours of work plus $3,200.
Properties of the Cost Curves $ MC • Ross Perot Equation • Short Run Cost Curve Shifters • Change in price of labor • Change in price of capital • Change in amount of capital • Change in technology $ MC ATC output AVC q/L AFC output MP labor
Austyn's total fixed cost is $3,600. Austyn’s employs 20 workers and pays each worker $60. The average product of labor is 30, the marginal product of the 20th worker is 12. What is the marginal cost of the last unit produced by the last worker Austyn’s hired? • $0.20 • $5 • $240 • $720
Ian’s fixed cost of mowing lawns is $250 and his marginal cost is constant at $10 per lawn. If Ian mows 5 lawns in one day, what is his average total cost? • $25 • $50 • $60 • $300
Long Run Costs • What is the optimal size for a factory? $ ATC1 ATC2 ATC4 LRAC ATC3 q2 output
LRAC Curve $ LRAC ATC3 Diseconomies of Scale Economies of Scale Specialization Coordination/Communication Problems qMES output EOS: double the inputs, output more than doubles LRAC falls DOS: double the inputs, output less than doubles LRAC rises
When all inputs increase by 40% and output rises by 30%, the firm is experiencing: • Diminishing returns • Economies of scale • Diseconomies of scale • Constant returns to scale
Perfect Competition: Price Taker Model • Characteristics of the Industry • Large number of small buyers/sellers • Homogeneous product • Free entry/exit • Perfect information firms are price takers MR = ΔTR / Δq $ $ S P1 P = MR D Q1 Quantity quantity Industry Firm
= TR – TC = P q - [FC + VC] What output should firm produce? produce until MR = MC If MR > MC produce more If MR < MC produce less Maximizing Profit $ MC MR $20 = P1 quantity q1 = 600 I want you to maximize profit What is TR = ? What is TC = ?
In a perfectly competitive industry, the market price of the product is $12. Firm A is producing the output at which average total cost equals marginal cost, both of which are $10. To maximize its profits, Firm A should: • expand output • reduce output • leave output unchanged • decrease its price
Profit and Loss Diagrams • Positive Profit • = Pq – (ATC)q • = (P-ATC)q • = (60-50)300 • = $3000 • Negative Profit • = (35-50)250 • = -$3750 • Zero Profit? $ MC ATC $60 = P1 MR1 $50 = ATC1 $35 = P2 MR2 quantity q2 = 250 q1 = 300
Juan’s Software Company is a perfect competitor. Juan has total fixed costs of $25,000, average variable costs for 1,000 units of the product of $45, and marginal revenue of $75. What is his total economic profit? • $5,000 • $25,000 • $45,000 • It is impossible to determine with the information given.
A wheat farmer operating in the short run produces 100 bushels of wheat. Her average total cost per bushel is $1.75, total revenue is $450, and (total) fixed costs are equal to $100. Then • average fixed cost is equal to $1.50. • profit per bushel is equal to $2.75. • average variable cost is equal to $1.25. • economic profit is equal to $250.
Sometimes it’s better to stay open and lose a little bit… • = TR – (FC +VC) • Temporary Shut Down: q = 0 • = Pq – (FC +VC) • = 0 – (FC + 0) • = - FC • Stay open if TR > VC • Shut down if TR < VC $ MC ATC AVC $35 = ATC1 $25 = P1 MR1 $20 = AVC1 quantity q1 = 2000 Stay open: = -$20,000 Shut down: = -$30,000
$480,000 $600,000 A competitive firm is maximizing profits by producing 600 units of output at the current market price of $800 per unit. The firm has AFC of $300 and total costs of $600,000 at this output level. -$120,000 $180,000 $420,000 $1,000 $300 $700 $800 Firm should stay open since TR > VC $800 -$180,000
How should a business react if… I have to remember to think at the margin! • Price rises? • Marginal costs rise? • Fixed costs rise? $ MC ATC AVC P1 MR1 quantity q1
Long Run Equilibrium • A = TR – Explicit Costs • E = A - Implicit Costs LRE: E = 0 Economy A= 6% E= 0% A= 9% E= 0% E= 3% A= 6% E= 0% A= 6% E= 0% if E > 0 entry occurs if E < 0 exit occurs
Long Run Adjustment Process $ $ MC ATC S1 S2 P2 MR2 LRS P1 MR1 D2 D1 Q1 Q3 Quantity q1 q2 quantity Industry Firm At P1: each firm produces q1 and earns E= 0 price rises to P2 Long run supply curve for a constant cost industry is horizontal Demand rises to D2: At P2: each firm produces q2 and earns E> 0 Since E> 0 , new firms will enter: supply shifts to S2 Price will fall back to P1 and E= 0
Market Demand Firm’s Cost 1000 firms in the industry