Download
1 / 8
80 likes | 298 Views
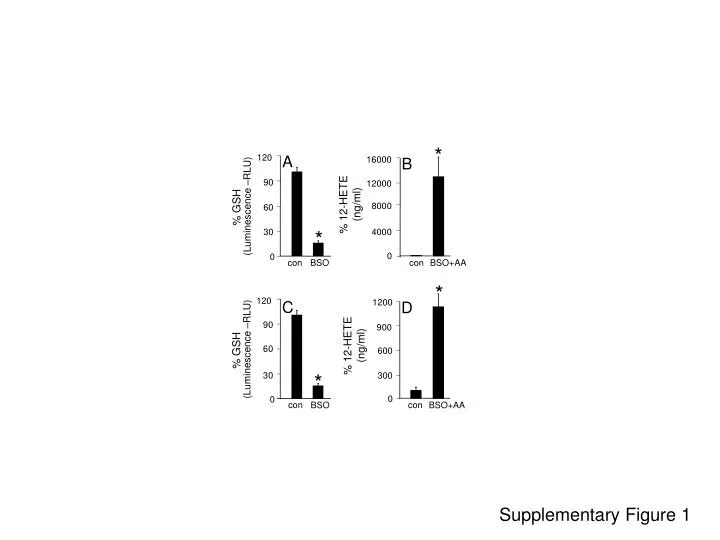
120. *. A. B. 16000. 90. 12000. 60. % 12-HETE (ng/ml). % GSH (Luminescence –RLU). 8000. *. 30. 4000. 0. con. BSO. 0. con. BSO+AA. *. C. D. 1200. 120. 900. 90. % 12-HETE (ng/ml). % GSH (Luminescence –RLU). 600. 60. 300. *. 30. 0.

E N D
120 * A B 16000 90 12000 60 % 12-HETE (ng/ml) % GSH (Luminescence –RLU) 8000 * 30 4000 0 con BSO 0 con BSO+AA * C D 1200 120 900 90 % 12-HETE (ng/ml) % GSH (Luminescence –RLU) 600 60 300 * 30 0 con BSO+AA 0 con BSO Supplementary Figure 1
C A † 9000 calcein miR-29b expression (% of control) 6000 3000 - - 100mm + + (24h) BSO + AA 0 control mimic miR-29b mimic PI † B * 300 * 200 % LDH leakage calcein + PI 100 0 control BSO+ AA control BSO+ AA control mimic miR-29b mimic control mimic miR-29b mimic Supplementary Figure 2
B † BSO+AA con A 8000 * control mimic † 6000 miR-29c expression (% of control) JC-1 green/red ratio (% change) FL2-H * 4000 con BSO+AA 700 miR-29c mimic 2000 600 - - + + (24h) 500 BSO + AA - - 0 + + (12h) BSO + AA 400 control mimic miR-29c mimic control mimic miR-29c mimic FL1-H 300 C D 200 † 100 * 600 0 calcein 500 100mm 100mm 400 % LDH leakage 300 PI * 200 100 0 0 calcein + PI control mimic miR-29c mimic control BSO+ AA control BSO+ AA control mimic miR-29c mimic Supplementary Figure 3
† * 900 B A con BSO+AA 120 * control inhibitor 600 90 JC-1 green/red ratio (% change) miR-29c expression (% of control) FL2-H 60 † 300 con BSO+AA 30 miR-29c inhibitor 0 - - + + (24h) BSO + AA - - + + (12h) 0 BSO + AA control inhibitor miR-29c inhibitor control inhibitor miR-29c inhibitor C D FL1-H † * 900 calcein * 100mm 100mm 600 % LDH leakage PI 300 calcein + PI 0 control inhibitor miR-29c inhibitor control BSO+ AA control BSO+ AA control inhibitor miR-29c inhibitor Supplementary Figure 4
* A B * 500 400 † 300 % LDH leakage † % LDH leakage 200 † † 250 100 200 0 - - - (mmol/L) 0.25 a-TCT 150 - - - (mmol/L) BL15 2.5 - - - (mmol/L) 0.25 a-TCT 100 (BSO+AA, 24h) - - - (mmol/L) BL15 2.5 50 (BSO+AA, 24h) 0 Supplementary Figure 5
100 350 300 80 250 60 200 A B C 100 * 150 40 * 75 100 * 20 % GSH (RLU/mg tissue) 50 % 12-HETE (ng/mg tissue) % arachidonic acid (ng/mg tissue) 50 0 0 25 100 120 0 100 100 80 * 80 80 con con con infarct infarct infarct 60 * 60 60 40 % docosahexaenoic acid (ng/mg tissue) % 15-HETE (ng/mg tissue) % 5-HETE (ng/mg tissue) con infarct con infarct 40 40 20 20 20 0 0 0 infarct con Supplementary Figure 6
150 150 150 100 100 100 50 50 50 miR-29c expression (% of control) miR-29a expression (% of control) miR-29b expression (% of control) 0 0 0 control control control infarct infarct infarct Supplementary Figure 7