Download
1 / 84
840 likes | 958 Views
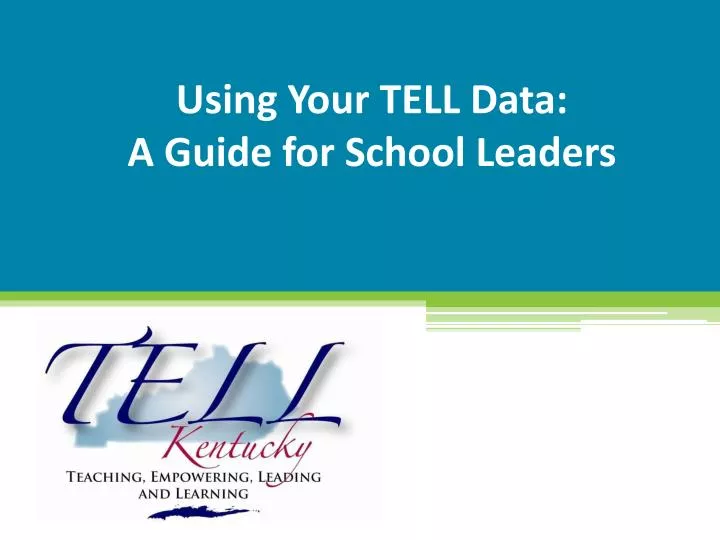
Using Your TELL Data: A Guide for School Leaders. Insert date here. Welcome. Insert your own welcome statement here. Training Objectives. Become familiar with your school’s data from the 2013 survey results and the website Understand the drill down process in order to analyze the data

E N D
Using Your TELL Data:A Guide for School Leaders Insert date here
Welcome • Insert your own welcome statement here
Training Objectives • Become familiar with your school’s data from the 2013 survey results and the website • Understand the drill down process in order to analyze the data • Be able to unpack, disseminate and discuss teaching conditions data to create action items for school improvement
Agenda • Connecting to the Data • Setting the Context • Drilling Down into the Data • Understanding the Constructs • Examining Items • Analyzing and Discussing a specific Item • Creating an Action Plan
Norms for the Discussion • Equity of Voice • Active Listening • Safety to Share Different Perspectives • Confidentiality • Other? ____________
Day and Night Partners • Find a Day partner who has a very different job than you. Write their name in your Day section and be sure they write your name in their Day section • Move on and go to a new person who has a similar job or content area and write each others’ names in your Night sections • Return to your seat
Connector Directions • Read the rating system • Reflect upon each Teaching Condition Construct and rate them from 1 (low) – 4 (high) • Reflect and write a few notes about each Teaching Conditions Construct • Find your Day partner and share out key points for 2 minutes each
Setting the Context CUSTOMIZE FOR YOUR PRESENTATION • Rationale for taking the survey • Information about the Survey
What We Know about Teaching Conditions • It matters for kids • It matters for teacher retention • Principals and teachers view teaching conditions differently
Reform is a Long Term Process According to new research by Linda Darling-Hammond, it takes 30 – 100 hours of professional development extended over a 6 – 12 month period to affect change in the classroom
Uses of the Data • As a baseline for improvement • As a metric (a way to measure) for improvement • As a way to help us prioritize our needs to inform our school improvement plan
“Using the Survey Results Effectively” Article • Read the article, taking notes on the Reflection work sheet • Respond to the prompts on the Reflection worksheet • Group Debrief
Basic TELL Vocabulary • TELL – Teaching, Empowering , Leading and Learning • Teaching Conditions – the systems, relationships, resources, environments and people in your school that affect your ability to teach (or learn) at a high level • Construct – a grouping of several specific questions, all dealing with the same topic • Time, Facilities and Resources, Community Support and Involvement, Managing Student Conduct, Teacher Leadership, School Leadership, Professional Development, and Instructional Practices and Support • Item – a specific individual question
Find your District and School State State State
What do the Numbers Mean? State State State
Impact of % Completing the Survey • Within schools in your district, there is a wide range of percentage of educators who completed the survey • With an elbow partner, reflect upon what those varieties of percentages can mean for your school? • Why are the percentages important to know?
Access to the Detailed Results State State State
Detailed Results State State District Level School State District Level School
Access to the Summary Results State State State
Summary Results State State District Level School State District Level School
Access to the Comparison Results State State State
Comparison Report State 2013 2011 School name
BREAK TIME ! Place this wherever needed.
Summary Report – Finding Your School Data State State District Level School State District Level School
Summary Report – Finding Your School Level Data State State District Level School State District Level School
Construct Indicator Worksheet Marking Your School Level Data 48.8 59.0
Summary Report – Finding Your District Data State State District Level School State District Level School
Construct Indicator Worksheet Marking Your District Data 48.8 59.0 55.4
Summary Report – Finding Your State Data State State District Level School State District Level School
Construct Indicator WorksheetMarking Your State Data 48.8 59.0 55.4 55.9
Summary Results Comparison Report – Results from 2011 State State State School Name 92.0% 84.4% 38.2% 45.6% 73.9% 78.3% 54.0%
Construct Indicator Worksheet – Marking Your Data from 2011 48.8 59.0 55.4 55.9 38.2
Construct Indicator Worksheet – Calculate Growth from 2011 to 2013 48.8 59.0 55.4 55.9 38.2 10.6
Compare Your School Data to the School Level Data 48.8 59.0 55.4 55.9 38.2 10.6 -10.2
Compare Your School Data to the District Data 48.8 59.0 55.4 55.9 38.2 10.6 -10.2 -6.6
Compare Your School Data to the State Data 48.8 59.0 55.4 55.9 38.2 -7.1 10.6 -10.2 -6.6
Prioritize the Constructs • Prioritize the Constructs on your own • “1” = highest priority; “8” = lowest priority • Compare your list with your table group • Together decide upon a common list • Record your greatest STRENGTH on a yellow post-it note • Record your greatest NEED on a blue post-it note
Prioritize the Constructs 48.8 59.0 55.4 55.9 2 38.2 -7.1 10.6 -10.2 -6.6 xx.x xx.x xx.x xx.x xx.x 6 xx.x xx.x xx.x xx.x
Construct a Consensogram • Have 1 person at your table place your yellow STRENGTH post-it above the appropriate construct on the poster • Place your blue NEED post-it above its construct as well • If there is already a post-it at the bottom of the chart, place your post-it above that one to make a bar chart
Consensogram 2.1A 2.1B 2.1C 2.1D 2.1E
Consensogram Findings • Examine the consensogram findings • Are there any patterns? • Which Constructs stand out? • Which Constructs are sparsely posted? • What does this tell us about how we perceive our school’s teaching conditions?
Range of % Agreement State State District Level School State District Level School
Choose an Item of interest Narrow your focus even further by prioritizing your Items for this Construct • Your item of focus does NOT have to be your lowest item score • You and your faculty know the context of your school. Use that knowledge to choose an item of greatest impact to explore further