Download
1 / 34
340 likes | 487 Views
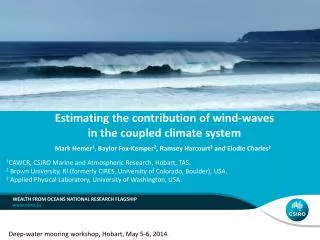
Surface wind-wave climate of the Pacific region: Variability, trends and future projections. Mark Hemer, Jack Katzfey and Galina Kelareva. Talk outline. Wind-waves in the climate context Project aims Phase 1: Climate drivers of historical wave climate variability

E N D
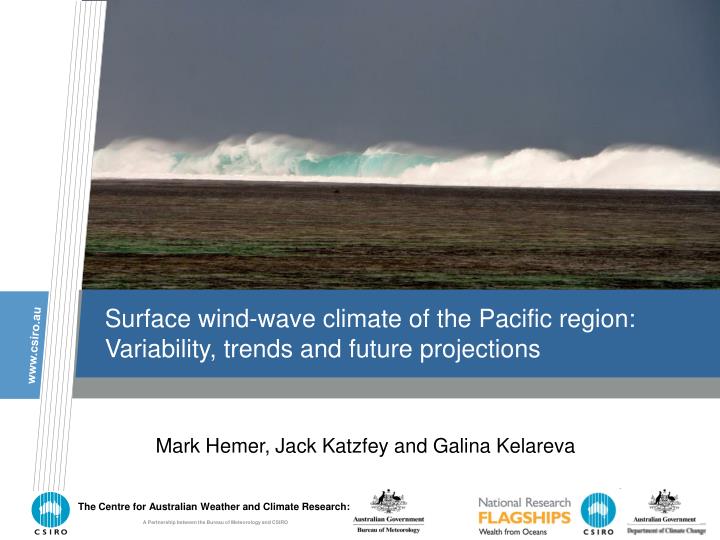
Surface wind-wave climate of the Pacific region: Variability, trends and future projections Mark Hemer, Jack Katzfey and Galina Kelareva
Talk outline • Wind-waves in the climate context • Project aims • Phase 1: Climate drivers of historical wave climate variability • Phase 2: Wave climate projections under future scenarios • Summary SOPAC STAR Conference 2010
Warming Atmosphere and Oceans Sea-level rise (0.2 – 0.8 m by 2100, IPCC AR4) Changes to weather systems and storms CHANGING RISK OF COASTAL IMPACTS Coastal impacts and climate change IPCC AR4 (WG-2) • Chapter 6: Coastal systems and low-lying areas. 6.8 Key uncertainties, research gaps and priorities [On climate change impact assessments in the coastal zone] …There also remains a strong focus on sea-level rise, which needs to be broadened to include all the climate drivers in the coastal zone (Table 6.2). Nicholls, R.J. et al. (2007) Coastal systems and low-lying areas. In: Climate Change 2007: The Physical Science Basis. Contribution of Working Group II to the Fourth Assessment Report of the Intergovernmental Panel on Climate Change [Parry, M.L. et al. (eds.)]. Cambridge University Press, Cambridge, Uniited Kingdon and New York, NY, USA. SOPAC STAR Conference 2010
INUNDATION: wind-wave setup is the dominant contributor to coastal flooding events Steep slope grid Shallow slope grid 30 56 wind speed (m/s) 30 56 wind speed (m/s) EROSION: wind-waves drive coastal sediment budgets. A shift in direction may lead to erosion. Storm surge (m) Wind-wave influences on the Pacific Islands and Territories DISTURBANCE: Marine habitats are characterised by the wave climate (energy) at that site. LAGOON CIRCULATION: wind-wave setup drives lagoon circulation. Changing wave conditions may influence flushing. SOPAC STAR Conference 2010
Project Aims: • Phase 1: • Make use of existing available wave data in the Pacific basin, characterise mean seasonal conditions, the historical inter-annual variability and/or trends, and the key climatological drivers of variability in the present day wave climate. • Phase 2: • Develop wave climate projections under future climate scenarios, for the Pacific basin, consideration of near-term future (2026-2045) and end of century (2070-2099). SOPAC STAR Conference 2010
Phase 1 (Available data) Satellite altimeter data (8 Missions) Global wave reanalyses ECMWF ERA-40 ERA-Interim Global wave models CSIRO (Phase 2 of project) Waverider buoy data (NDBC and SOPAC) SOPAC STAR Conference 2010
High latitude storm belt High latitude storm belt Mean Annual Significant Wave Height (m) Phase 1: Preliminary Results (ERA-Interim: 1989-2009) SOPAC STAR Conference 2010
Correlation Coefficient MapEFC-ERA40 components vs SOI (All monthly means) EF = E.cg = F (Hs, Tm, Dm), EF is a vector (eastwards component, EFu, northwards component EFv) -0.5 0 0.5 Pearson’s correlation coefficient, R. Bounded regions indicate significant correlation at 95% confidence level. Hemer et al. (2010) SOPAC STAR Conference 2010
Comparisons of HS trends in Satellite Era. Ongoing work: Test robustness of these results using other available datasets, with the focus being on the full Pacific basin -0.05 0 0.05 HS Trend (m/yr) SOPAC STAR Conference 2010
Phase 2: Wave climate projections • IPCC AR4 (WG1) Box 11.5: Coastal Zone Climate Change • Introduction • …. There is insufficient information on changes in waves or near-coastal currents to provide an assessment of the effects of climate change on erosion. Christensen, J.H. et al. (2007) Regional Climate Projections. In: Climate Change 2007: The Physical Science Basis. Contribution of Working Group I to the Fourth Assessment Report of the Intergovernmental Panel on Climate Change [Solomon, S. et al. (eds.)]. Cambridge University Press, Cambridge, United Kingdom and New York, NY, USA. SOPAC STAR Conference 2010
Map of current regional projections Global projections: Wang & Swail, 2006 Mori et al., 2009 SOPAC STAR Conference 2010
Regional projections (methodology) Subset of CMIP outputs GCM1 Scenario B GCM2 Scenario A GCM1 Scenario A GCM2 Scenario B Regional Climate Model RCM2 Scenario A RCM1 Scenario A RCM1 Scenario B RCM2 Scenario B Near surface winds force wave model Typically for time slices (present, future) Wave1 Scenario A Wave1 Scenario B Wave2 Scenario B Wave2 Scenario A Ensemble mean wave projection Scenario B Ensemble mean wave projection Scenario A SOPAC STAR Conference 2010
Dynamical downscaling (PCCSP) and wave projection methodology Using multiple global climate models (GCMs) to capture uncertainty of future climate change. (SRES A2 scenario) 1. CSIRO Mk3.5 4. ECHAM5 2. MIROC 5. HadCM3 3. GFDLcm2.0 6. GFDLcm2.1 The method used is: • Correct sea surface temperature biases from global climate models (GCMs) • Downscale to 60 km resolution (CSIRO CCAM model) • Use 60km resolution surface winds to force global 1 degree wave model GCM Bias corrected SST-only Global 60 km Surface Winds and Sea-Ice only SOPAC STAR Conference 2010
Global wave model • WAVE MODELLING • Global 1 degree wave model • WaveWatch III (v3.14, default configuration) • Forced with global CCAM winds • 1st run. CCAMECHAM5 SRES A2 • Two time-slices • Present – 1979-2009 • Future - 2080-2099 Mean Hs (m) CCAMECHAM5 – ERA-Interim: 10yr mean D HS (m) SOPAC STAR Conference 2010
Phase 2: ongoing work • Validation of climate model forced wave climate for present time-slice • Repeat runs with other climate model forcing (assess uncertainty) • Aiming for follow-on project to provide detailed coastal assessments for specific islands. PCCSP climate model downscaling to 8km at selected PICTs. Use these projections to generate high res wave projections SOPAC STAR Conference 2010
IPCC AR4 projections Likely ranges include uncertainties between: - climate models (multi-model ensembles), and - model versions (perturbed physics ensembles) Figure 3.2. Surface warming for SRES scenarios. Best estimates, and 2090-2099 likely ranges IPCC AR4 (2007) Synthesis Report SOPAC STAR Conference 2010
Available Global Wave Projections: Existing Global projections Wang & Swail, 2006 Statistical Hs projn. Ensemble mean: CGCM2 (3PPE); HADCM3 (1PPE); ECHAM4/OPYC3 (1PPE) SRES A2 scenario 2080-1990 diff. 0.2 0.12 0.04 m -0.04 -0.12 -0.2 Mori et al., 2009 Dynamical (SWAN) Hs projn. 20km MRI/JMA AGCM IPCC AR4 (CMIP3) ensemble mean SST as BBforcing SRES A1B scenario 2075-2099 mean – 1979-2003 mean diff (m) SOPAC STAR Conference 2010
Towards a coordinated approach to global wave projections (Hemer et al., 2010) Emission Scenario Multi-Model Ensembles Perturbed Physics Ensembles Wave Projection Ensembles SRES Scenario … Climate Modelling Centre A Climate Modelling Centre B Climate Modelling Centre C PPE1 PPE2 PPE3 PPE1 PPE2 PPE1 PPE2 PPE3 … Statistical wave projection Dynamical wave projection Wave Modelling Group B (model2) Wave Modelling Group A (model1) ?? ?? ?? e.g., 1. Raw or corrected forcing/covariate, 2. Perturbed physics in dynamic wave model, … WCRP/JCOMM workshop on coordinated wave climate projections (April 2011, Geneva) http://www.jcomm.info/cowclip SOPAC STAR Conference 2010
Summary • Important to understand climatological influence on wind-waves for Pacific Island coastal impact assessments • Phase 1 of project ongoing investigating key climatological drivers of historical wave climate variability • Phase 2 of project ongoing projecting wave climate for the Pacific basin, with the framework of internationally coordinated global wave climate projections. SOPAC STAR Conference 2010
Thankyou Dr. Mark Hemer Mark.Hemer@csiro.au The Centre for Australian Weather and Climate Research: • A Partnership between the Bureau of Meteorology and CSIRO SOPAC STAR Conference 2010
IPCC AR4 (WG-2) • Chapter 6: Coastal systems and low-lying areas. 6.8 Key uncertainties, research gaps and priorities [On climate change impact assessments in the coastal zone] …There also remains a strong focus on sea-level rise, which needs to be broadened to include all the climate drivers in the coastal zone (Table 6.2). Nicholls, R.J. et al. (2007) Coastal systems and low-lying areas. In: Climate Change 2007: The Physical Science Basis. Contribution of Working Group II to the Fourth Assessment Report of the Intergovernmental Panel on Climate Change [Parry, M.L. et al. (eds.)]. Cambridge University Press, Cambridge, Uniited Kingdon and New York, NY, USA. SOPAC STAR Conference 2010
Dominant contribution to coastal inundation on Pacific Islands is from wave setup Potential Impacts: Flooding Infrastructure damage freshwater contamination, etc. Wave driven inundation event, Cyclone Meena, Rarotonga, Feb 2005 SOPAC STAR Conference 2010
Steep slope grid Shallow slope grid Steep slope grid 30 56 wind speed (m/s) 30 56 wind speed (m/s) Shallow slope grid 30 56 wind speed (m/s) Steep slope grid Shallow slope grid 30 56 wind speed (m/s) SOPAC STAR Conference 2010
Waves are a key driver of geomorphological response An Island with sandy beaches: No waves SOPAC STAR Conference 2010
Waves are a key driver of geomorphological response (erosion and accretion) of islands An Island with sandy beaches: Southerly waves Wave front Wave front SOPAC STAR Conference 2010
Wave front Wave front Waves are a key driver of geomorphological response (erosion and accretion) of islands An Island with sandy beaches: Wave climate rotates to South-Westerly Erosion Accretion Potential impacts: loss of useable land SOPAC STAR Conference 2010
Disturbance/Sediment supply • Marine habitats are characterised by the energy of the site. Wave climate characterises large scale reef morphology, species distributions and nutrient uptake. SOPAC STAR Conference 2010
Waves drive circulation within reef lagoons. Changed conditions may alter flushing times, water quality and sand budgets. From Lowe et al., 2009 SOPAC STAR Conference 2010
Phase 1: Available Data SOPAC STAR Conference 2010
Directional Distribution (ERA-40) 100 50 % 0 SOPAC STAR Conference 2010
Directional Distribution Trends (ERA-40: 1957-2002) 1 0 %/yr -1 SOPAC STAR Conference 2010
Map of current regional projections Netherlands USA China, Japan Bahamas, Belize Cayman Islands, Turk and Caicos Islands Bangladesh Egypt Vietnam India Philippines Gambia Marshall Islands Djibouti Guyana, Suriname Thailand Tuvalu Indonesia Maldives Global projections: Wang & Swail, 2006 Mori et al., 2009 Countries with highest share of population within Low Elevation Coastal Zone (all countries) Countries with most population within Low Elevation Coastal Zone, McGranahan et al. (2007) SOPAC STAR Conference 2010
8 Km region selection criteria SOPAC STAR Conference 2010
8 Km domains 8 km domains in red Extra DDS domain in green SOPAC STAR Conference 2010