Download
1 / 35
350 likes | 480 Views
Companies Run By Shareholders, For Shareholders Kimberly Dang Chief Financial Officer. May 23, 2013. Forward-Looking Statements / Non-GAAP Financial Measures.

E N D
Companies Run By Shareholders, For Shareholders Kimberly DangChief Financial Officer May 23, 2013
Forward-Looking Statements / Non-GAAP Financial Measures • This presentation contains forward-looking statements. These forward-looking statements are identified as any statement that does not relate strictly to historical or current facts. In particular, statements, express or implied, concerning future actions, conditions or events, future operating results or the ability to generate revenues, income or cash flow or to make distributions or pay dividends are forward-looking statements. Forward-looking statements are not guarantees of performance. They involve risks, uncertainties and assumptions. Future actions, conditions or events and future results of operations of Kinder Morgan Energy Partners, L.P., Kinder Morgan Management, LLC, El Paso Pipeline Partners, L.P., and Kinder Morgan, Inc. may differ materially from those expressed in these forward-looking statements. Many of the factors that will determine these results are beyond Kinder Morgan's ability to control or predict. These statements are necessarily based upon various assumptions involving judgments with respect to the future, including, among others, the ability to achieve synergies and revenue growth; national, international, regional and local economic, competitive and regulatory conditions and developments; technological developments; capital and credit markets conditions; inflation rates; interest rates; the political and economic stability of oil producing nations; energy markets; weather conditions; environmental conditions; business and regulatory or legal decisions; the pace of deregulation of retail natural gas and electricity and certain agricultural products; the timing and success of business development efforts; terrorism; and other uncertainties. There is no assurance that any of the actions, events or results of the forward-looking statements will occur, or if any of them do, what impact they will have on our results of operations or financial condition. Because of these uncertainties, you are cautioned not to put undue reliance on any forward-looking statement. Please read "Risk Factors" and "Information Regarding Forward-Looking Statements" in our most recent Annual Reports on Form 10-K and our subsequently filed Exchange Act reports, which are available through the SEC’s EDGAR system at www.sec.gov and on our website at www.kindermorgan.com. • We use non-generally accepted accounting principles (“non-GAAP”) financial measures in this presentation. Our reconciliation of non-GAAP financial measures to our GAAP financial statements can be found on our website at www.kindermorgan.com. These non-GAAP measures should not be considered an alternative to GAAP financial measures.
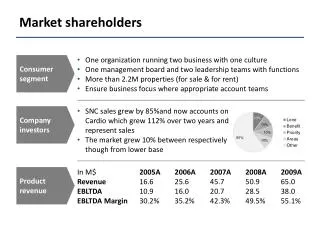
Kinder MorganFour Ways to Invest: KMI, KMP, KMR & EPB PublicFloat Kinder Morgan, Inc. Market Equity $44.4B (a) Debt 9.4B (b) Enterprise Value $53.8B 2013E Dividend per Share $1.60 (c) 666MM(64%) Cashdividends toshareholders Management/Original S/H KMI (C-corp) 1,036 MM shares (a) 301MM (d)(29%) Sponsor 69MM(7%) Kinder Morgan Energy Partners, L.P. Market Equity $37.4B (e) Debt 18.4B (f) Enterprise Value $55.8B 2013E LP Distribution per Unit $5.33 (c) El Paso Pipeline Partners, L.P. Market Equity $9.4B (e) Debt 4.1B (f) Enterprise Value $13.5B 2013E LP Distribution per Unit $2.55 (c) LP & GPdistributions Sharedividends toshareholders Cashdistributionsto unitholders Cashdistributionsto unitholders KMR (LLC) 119 MM shares (e) KMP (Partnership) 307 MM units (e) EPB (Partnership) 216 MM units (e) 27MM(9%) 126MM(58%) 103MM(87%) 16MM(13%) 90MM(42%) 280MM(91%) PublicFloat KMI PublicFloat PublicFloat KMI • __________________________ • Market prices as of 5/17/2013; KMI market equity based on ~1,036 million shares outstanding at a price of $40.48 and ~423 million warrants at a price of $6.01. • Debt of KMI and its subsidiaries as of 3/31/2013; excludes debt of KMP and its subsidiaries and EPB and its subsidiaries; excludes the fair value of interest rate swaps, purchase accounting and Kinder Morgan G.P., Inc.’s $100 million of Series A Fixed-to-floating Rate Term Cumulative Preferred Stock due 2057, net of cash. • 2013 forecast for KMI and KMP, 2013 budget for EPB. • Reflects KMI form-4 filers only. • Market prices as of 5/17/2013; KMP market equity based on ~307 million common units (includes 5.3 million Class B units owned by Kinder Morgan, Inc.; Class B units are unlisted KMP common units) at a price of $88.38, ~119 million KMR shares at a price of $86.22, and ~216 million EPB units at a price of $43.18. KMP figures are adjusted for acquisition of Copano. • Debt balances of KMP and EPB as of 3/31/2013; exclude the fair value of interest rate swaps, net of cash. KMP figures are adjusted for acquisition of Copano.
Our StrategyStay the Course • Focus on stable fee-based assets that are core to North American energy infrastructure • Market leader in each of our business segments • Control costs • It’s the investors’ money, not management’s – treat it that way • Leverage asset footprint to seek attractive capital investment opportunities, both expansion and acquisition • KMP has completed approximately $22 billion in acquisitions and $16 billion of greenfield / expansion projects since inception (a) • Maintaining a strong balance sheet is paramount • KMP accessed capital markets for approximately $36 billion since inception (b) • Investment grade since inception • Transparency to investors Same Strategy Since Inception • __________________________ • From 1997 through 1Q 2013, further adjusted to include the acquisition of Copano. • Gross capital issued since inception through 1Q 2013, further adjusted to include the acquisition of Copano. Net of refinancing, approximately $34 billion of capital raised.
Kinder MorganUnparalleled Asset Footprint • 3rd largest energy company in North America with combined enterprise value of approximately $115 billion (a) • Largest natural gas network in U.S. • Own an interest in / operate almost 70,000 miles of natural gas pipeline • Connected to every important U.S.natural gas resource play, including:Eagle Ford, Marcellus, Utica, Uinta,Haynesville, Fayetteville and Barnett • Largest independent transporter of petroleum products in U.S. • Transport ~1.9 MMBbl/d (b) • Largest transporter of CO2 in U.S. • Transport ~1.3 Bcf/d of CO2(b) • Largest independent terminal operatorin U.S. • Own an interest in or operate ~180liquids / dry bulk terminals • ~112 MMBbls domestic liquids capacity • Handle ~106 MMtons of dry bulkproducts (b) • Only Oilsands pipe serving West Coast • TMPL transports ~300 MBbl/d to Vancouver / Washington State; expansion under way increasing capacity to 890 MBbl/d • __________________________ • Combined enterprise value of KMI, KMP & EPBas of 5/17/2013; see footnotes on slide 3 forfurther information. • 2013 budgeted volumes.
17 Years of Consistent Growth at KMP KMP Total Distributions (GP + LP) ($MM) KMP Annual LP Distribution per Unit (c) (a) (a) 1996-2013E CAGR = 13% (b) 1996-2013E CAGR = 38% KMP Net Debt to EBITDA (d) (a) __________________________ • 2013 forecast. • In 2010, total distributions paid were $2,280 million. These distributions would have been $2,450 million ($170 million greater) if all distributions paid in August 2010 had been cash from operations, rather than a portion being a distribution of cash from interim capital transactions; the GP receives only 2% of distributions of cash from interim capital transactions. • Annual LP declared distributions, rounded to 2 decimals where applicable. • Debt is net of cash and excluding fair value of interest rate swaps.
Significant Historical Returns (a) KMP: 25% CATR Since ‘96 (b) KMI: 18% CATR Since Inception (e) KMR: 16% CATR Since Inception (c) __________________________ • Source: Bloomberg. • Total returns calculated on daily basis through 5/17/2013, except where noted;assumes dividends / distributions reinvested in index / stock / unit. • Start date 12/31/1996. • Start date 5/14/2001; KMR initial public offering; KMP CATR over same period is 15%. • Alerian MLP Index. • Start date 2/10/2011; KMI initial public offering. • Total return from IPO, 2/10/2011 through 12/31/2012. • Start date 5/25/2012; EP acquisition close.
Budget GuidancePromises Made, Promises Kept Promises Made Promises Kept KMI BudgetedDividend: 2011: $1.16 (a) 2012: $1.35 KMP Budgeted LP Distribution: 2000: $1.60 2001: $1.95 2002: $2.40 2003: $2.63 2004: $2.84 2005: $3.13 2006: $3.28 2007: $3.44 2008: $4.02 2009: $4.20 2010: $4.40 2011: $4.60 2012: $4.98 EPB ForecastedLP Distribution: 2012: $2.25 KMI ActualDividend: 2011: $1.20 (a) 2012: $1.40 KMP Actual LP Distribution: 2000: $1.71 2001: $2.15 2002: $2.435 2003: $2.63 2004: $2.87 2005: $3.13 2006: $3.26 2007: $3.48 2008: $4.02 2009: $4.20 2010: $4.40 2011: $4.61 2012: $4.98 EPB ActualLP Distribution: 2012: $2.25 KMP achievedLP distributiontarget in 12out of 13 years • __________________________ • Presented as if KMI were publically traded for all of 2011.
2013 GuidanceSupported by Diversified Cash Flow BUS NESS M X CO2 S&T • KMI Forecast: • KMI 2013 dividend: $1.60/sh (14.3% growth) • Fully-consolidated year-end 2013 debt / EBITDA = 5.0x(a) • KMP Forecast: • KMP 2013 LP distribution: $5.33/unit (7.0% growth) • Year-end 2013 debt / EBITDA = 3.8x (a) • EPB Budget: • EPB 2013 LP distribution: $2.55/unit (13.3% growth) • Expected dropdown from KMI of 50% interest in Gulf LNG • Year-end 2013 debt / EBITDA = 3.9x (a) CO2 OilProduction Natural GasPipelines Terminals KM Canada ProductsPipelines CO2 S&T I CO2 OilProduction Natural GasPipelines Terminals KM Canada ProductsPipelines I Natural GasPipelines (b) • __________________________ • Year-end 2013 leverage metric; does not take into account the full-year benefit from 2013 dropdowns. • Segment earnings before DD&A including proportionate share of JV DD&A and excluding certain items.
5-year Project BacklogOver $13 Billion of Identified Organic Growth Projects Tremendous footprint provides over $13B of growth opportunities over next 5 years (a) • __________________________ • Includes KM's proportionate share of non-wholly owned projects.Includes projects currently under construction. • CO2 EOR = Enhanced Oil Recovery.
Vast Opportunity SetLeverages Diverse Energy Themes Pipeline / terminalexpansions for Oilsandsexport to Asia Canadian naturalgas demandleading to expansionopportunities Cochin conversion/reversal forOilsands diluent Northeast powerdemand growthto be fueled bynatural gas Pipelineconversion /handling forshale liquids Terminals exportcoal handling CO2 source /transportationexpansion to meetrecord demandfor CO2 EOR Pipeline conversionand / or crude-by-railproviding supplydiversity to West Coast LNGLiquefaction Pipelineconversion /handling forshale liquids Mexican naturalgas demand growthleading to expansionopportunities Southeast powerdemand growthto be fueled bynatural gas LNGLiquefaction Terminals exportcoal handling
KMP’s Diversified Cash Flow • 55% interstate pipelines • 31% gathering, processing & treating • 14% intrastate pipelines & storage • 56% pipelines • 44% associated terminals & transmix • 58% liquids • 42% bulk • 28% CO2 transport and sales • 72% oil production-related • Production hedged (b): 2013=80% ($94)2014=52% ($94)2015=32% ($93)2016=14% ($89) • 100% petroleum pipelines Natural Gas Pipelines 2013E KMP SegmentEarnings before DD&A= $5.7 billion (a) Products Pipelines CO2 S&T Natural Gas Pipelines CO2 OilProduction Terminals CO2 Terminals Kinder MorganCanada Products Pipelines Kinder Morgan Canada • __________________________ • 2013 forecast segment earnings before DD&A including proportionate amount of JV DD&A and excluding certain items. • Percent of expected Apr-Dec 2013 net crude oil and heavier natural gas liquids (C4+) production.
KMP 2013 Growth Expenditure Forecast Without acquisitions= $2.8 billion (a) With acquisitions= $10.0 billion CO2 CO2 S&T S&T Oil Terminals Natural GasPipelines Natural GasPipelines CO2 OilProduction ProductsPipelines (b) Terminals ProductsPipelines (b) __________________________ • Includes contributions to joint ventures • Excludes acquisitions and associated expansion capex. • Includes the growth capital expenditures of the Kinder Morgan Canada segment, $67 million.
$40B of Growth Capital Invested at KMP (a,b,c) ($ in billions) Total Invested by Type Total Invested by Year (c) Total Invested by Segment __________________________ • Includes equity contributions to joint ventures. • From 1997 through full-year 2013 (forecast). • 2012 net of proceeds from FTC Rockies divestiture.
How We Have Done: KMP Returns on Capital • __________________________ • Note: a definition of these measures may be found in the Appendix to this presentation. • G&A is deducted to calculate the KMP ROI, but is not allocated to the segments and therefore not deducted to calculate the individual Segment ROI.
EPB System Map Pipelines: 100% Wyoming Interstate Co. (WIC) 100% Colorado Interstate Gas (CIG) 100% Cheyenne Plains (CP) 100% Southern Natural Gas (SNG) 100% Elba Express (EEC) LNG: 100% Southern LNG (SLNG)
EPB Focused on Natural Gas Pipelines • Highly stable cash flow stream • 89% interstate pipelines • Average contract life = ~7 years • 11% LNG • Average contract life = ~19 years (b) • Minimal throughput and commodity exposure • More than 90% of revenue comes from capacity reservation charges • Opportunities for growth • Full-yr of integration cost savings • Dropdown opportunities from KMI • Expected 2013 dropdown from KMI of 50% interest in Gulf LNG • Expansion opportunities • 2013 budgeted growth capex = $158 million • Growing power generation demand in Southeast • LNG exports • Demand growth on Front Range, Colorado • Storage in Rockies and Southeast 2013E EPB SegmentEarnings before DD&A= $1.2 billion (a) Natural Gas Natural Gas Pipelines • __________________________ • Segment earnings before DD&A including proportionate amount of JV DD&A and excluding certain items. • LNG average contract life includes both Elba Island and Gulf.
KMI Remaining Assets Available For DropdownPlan to move all assets to KMP / EPB over time, except NGPL
KMI Overview • KMI pays regular c-corp dividend with attractive combination of yield plus growth • KMI Investments / Assets: • Investment in MLPs • KMP: • General Partner (GP) interest receives incentive distributions from KMP • KMI owns ~10% of total limited partner (LP) interests • EPB: • GP interest receives incentive distributions from EPB • KMI owns ~42% of total LP interests • KMI intends to return to being a pure-play GP in 2014 with completion of dropdowns • Remaining assets available for dropdown: • 50% of Gulf LNG (GLNG) (a) • 50% of Florida Gas Transmission (FGT) • 50% of Ruby • KMI’s legacy 20% investment in NGPL – no current plans to dropdown • Substantial management ownership of KMI stock: • Public ~64% • Rich Kinder, other management and original stockholders ~29% • Sponsor ~7% __________________________ • 2013 budget contemplates dropdown of 50% interest in GLNG to EPB.
Risks • Regulatory (KMP/EPB/KMI) • Pacific Products Pipeline FERC / CPUC cases • Periodic rate reviews • Unexpected policy changes • Crude oil production volumes (KMP) • Crude oil prices (KMP) • 2013 budget assumes $91.68/Bbl realized price on unhedged barrels • 2013 sensitivity is ~$5.9 million DCF per $1/Bbl change in crude oil prices • Economically sensitive businesses (e.g., steel terminals) (KMP) • Environmental (e.g., pipeline / tank failures) (KMP/EPB/KMI) • Terrorism (KMP/EPB/KMI) • Interest rates (KMP/EPB/KMI) • Full-year impact of 100-bp increase in floating rates equates to ~$61 million increase in interest expense at KMP (a) • __________________________ • As of 3/31/2013 further adjusted for Copano acquisition, approximately $6.1 billion of KMP’s total $18.4 billion in net debt was floating rate.
SummaryKMI, KMP, KMR & EPB: Attractive Value Proposition Long-term Growth Targets (a) Next 3 to 5 Years (2012+) KMP = ~5-6% EPB = ~5-6% KMI = ~9-10% • Unparalleled asset footprint • Highly visible, attractive dropdown inventory • Significant, identified growth opportunities • Attractive returns driven by combination of yield plus growth • Established track record • Industry leader in all business segments • Experienced management team • Supportive general partner • Transparency to investors • __________________________ • Growth rates based on distribution per unit / dividend per share.
KMR 101 • KMR is KMP • KMR shares are pari passu with KMP units • KMR dividend equal to KMP cash distribution, but paid in additional shares; effectively a dividend reinvestment program (a) • Like KMP units, KMR shares are tax efficient - but with simplified tax reporting (no K-1s, UBTI) • KMR is a significant entity • KMR market cap = $10.2 billion, ~30% of total KMP capitalization (b) • ~$35 million in daily liquidity • KMR has generated a 15.6% compound annual total return since 2001 IPO, vs. 15.1% for KMP (c) • KMR trading discount to KMP represents an attractive opportunity • Potential for KMP to become self-funding through KMR dividend • Possibility of KMR share buybacks if quarterly dividends exceed equity funding needs (not anticipated any time soon) • Insiders prefer KMR KMR Discount to KMP (b) Management Purchases of KMR / KMP (d) • __________________________ • Calculation of share dividend: KMP quarterly cash distribution per unit divided by KMR 10-day average price prior to x-date = fractional share paid for every KMR share owned, e.g. $1.30 / $88.015 = 0.014770 share; example reflects actual KMR share dividend calculated for 1Q 2013 paid on 5/15/2013; refer to KMP’s periodic SEC filings on Forms 10-K and 10-Q for more information. • As of 5/17/2013, see footnotes on slide 3 for additional information. • As of 5/17/2013, see footnotes on slide 9 for explanation of total return calculations. • Purchase of KMR shares and KMP units by directors and officers of KMR/KMP since the KMR IPO in 2001, as reported in SEC Form 4 filings;10:1 ratio excludes one open market purchase of KMP units relating to an arrangement requiring cash distributions for payment of interest.
Toll Road-like, Fee-based Business Model • __________________________ • All figures as of 1/1/2013 except where noted (excludes Copano). • Transportation for intrastate pipelines includes term purchase and sale portfolio. • Excludes Express Pipeline. Assumes 1-year rate 2013 settlement on Trans Mountain, negotiations on a 3-5 year settlement are still underway. • Percent of expected Apr-Dec 2013 production, includes heavier NGL components (C4+). • Terminals not FERC regulated, except portion of CALNEV.
Natural Gas PipelinesSegment Outlook Well-positioned connecting key natural gas resource plays with major demand centers • Project Backlog: • $3.5 billion of identified growth projects over next five years (a), including: • TGP Northeast upgrade • LNG liquefaction (FTA @ Gulf & Elba Island) • Eagle Ford gathering & processing • SNG / Elba Express expansions • Sierrita lateral to Mexico border • Long-term Growth Drivers: • Attractive dropdown inventory at KMI • Natural gas the logical fuel of choice • Cheap, abundant, domestic and clean • Unparalleled natural gas network • Sources natural gas from every important natural gas resource play in the U.S. • Eagle Ford, Marcellus, Utica, Uinta, Haynesville, Fayetteville, Barnett, Mississippi Lime and Eaglebine • Connected to every major demand center in the U.S. • Demand growth and shifting supply from multiple basins • Power / gas-fired generation • Industrial and petchem demand • Growth in Mexican natural gas demand • Repurposing portions of existing footprint • Greenfield development • Expand service offerings to customers(e.g. treating and G&P) • LNG exports • Acquisitions • __________________________ • Excludes acquisitions and dropdowns, includes KM's shareof non-wholly owned projects.Includes projects currently under construction.
Products PipelinesSegment Outlook Opportunities for growth from increased liquids production • Project Backlog: • $0.9 billion of identified growth projects over next two years (a), including: • Cochin reversal & diluent conversion • Condensate processing • Sweeney lateral • Parkway • Double Eagle • Long-term Growth Drivers: • Development of shale play liquids infrastructure (condensate transportation and processing) • Repurposing portions of existing footprint in different product uses • RFS (b) increases demand for storage and ancillary services • Ethanol and biodiesel growth including terminals and pipeline expansions • Tariff index adjustments • Tuck-in acquisitions • __________________________ • Excludes acquisitions, includes KM's share of non-whollyowned projects.Includes projects currently under construction. • RFS (U.S. Renewable Fuels Standard) requires anincrease in use of renewable fuels, from 17 Bgal/yr in2013 to 36 Bgal/yr in 2022.
TerminalsSegment Outlook Well-located in refinery / port hubs and inland waterways • Project Backlog: • $1.7 billion of identified growth projects over next three years(a), including: • Liquids • Edmonton Phase I / II expansions • BOSTCO project • Houston terminal network expansion • Bulk • Deepwater coal handling • IMT Phase I / II / III coal handling • BP Whiting petcoke handling • Port of Houston export coal • Long-term Growth Drivers: • Gulf Coast diesel and gasoline exports • Crude oil merchant tankage • Crude by rail • Newbuild / expansion of export coal terminals • Chemical Infrastructure and base business growth built on production increases • Tuck-in acquisitions • __________________________ • Excludes acquisitions, includes KM's share of non-whollyowned projects.Includes projects currently under construction.
CO2Segment Outlook Own and operate best source of CO2 for EOR (a) • Project Backlog: • Identified growth projects totaling $1.1 billion and $1.0 billion in S&T and EOR (a), respectively, over next five years (b), including: • S&T • McElmo / Doe Canyon expansion • St. Johns build-out • Oil Production • SACROC / Yates / Katz • SACROC NGL plant & gathering • Long-term Growth Drivers: • Strong demand for CO2 drives volume and price • Billions of barrels of domestic oil still in place to be recovered at SACROC, Yates and Katz, including potential exploitation of additional zones • __________________________ • EOR = Enhanced Oil Recovery. • Excludes acquisitions, includes KM's share of non-whollyowned projects.Includes projects currently under construction.
Kinder Morgan CanadaSegment Outlook Sole oil pipeline from Oilsands to West Coast / export markets • Project Backlog: • $5.4 billion expansion of TMPL • Long-term Growth Drivers: • Expand Oilsands export capacity to West Coast and Asia • Following successful open season, major expansion plans under way • More than doubling capacity from 300 MBbl/d currently to approximately 890 MBbl/d • Strong commercial support from shippers with binding long term contracts for 708 MBbl/d of firm transport capacity • Projected cost of $5.4 billion • Proceeding with project design, planning and consultation • Expected in-service late 2017 • Expanded dock capabilities (Vancouver) • TMPL expansion will increase dock capacity to over 600 MBbl/d • Access to global markets
KMP Purchase of Copano for ~$5 BillionTransaction Announced 1/29/2013, Closed 5/1/2013 • KMP announced a definitive agreement to acquire Copano • KMP acquired all of Copano’s outstanding units • 100% unit-for-unit transaction; exchange ratio of 0.4563 KMP units per Copano unit • Immediate and long-term accretion to cash available to KMP unitholders • KMI to forego $120 million in each of 2014 and 2015, $110 million in 2016 and decreasing by $5 million per year thereafter • Modest accretion to KMP in 2013; ~$0.10/unit accretion in 2014 and thereafter • Immediately accretive to KMI’s cash available to pay dividends, even after foregoing a portion of the incremental IDR produced by this transaction • Increase in KMI’s cash available to pay dividends (net of amounts foregone) expected to be ~$25 million in 2014 growing to $70 million in 2016 • Retained vast majority of Copano’s 415 employees and Tulsa regional office
Copano AcquisitionStrategic Combination • Strategic Combination: • Complementary assets broaden KMP’s midstream services footprint and provide entry into new production areas • Provides gathering, processing, and fractionation growth platform • Proven operations team with track record of delivering growth • Expertise and best practices to benefit existing KMP midstream assets • Significant backlog of identified growth projects over next three years • Strong rich-gas play presence • Substantial long-term, fee-based cash flows • Copano Overview: • Natural gas gathering, intrastate transmission, processing, treating, and NGL fractionation services • Operates or owns an interest in: • 6,900 miles of pipeline with 2.7 Bcf/d of natural gas throughput capacity • 9 processing plants with more than 1 Bcf/d of processing capacity • 315 MMcf/d of treating capacity • Texas: gathers, transports, processes and fractionates gas from S. Texas (Eagle Ford), N. Texas (Barnett Shale Combo) and the Upper Gulf Coast (Woodbine) • Upon close, KMP to own 100% of Eagle Ford Gathering JV • Oklahoma: gathers and processes gas in central / eastern Oklahoma (Mississippi Lime and Hunton Dewatering play) • Rocky Mountains: gathers and treats gas in NE Wyoming (coal bed methane with potential for Niobrara) Copano Pipelines Copano Processing Plant