Download
1 / 38
380 likes | 551 Views
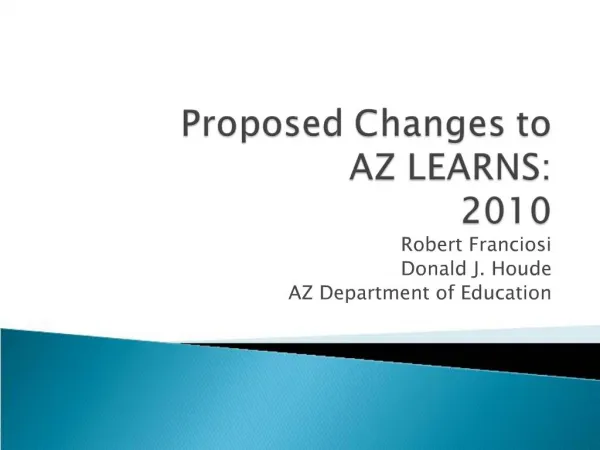
AZ Learns and A-F Letter Grades. Arizona Department of Education Presentation to the NCAASE Committee ASU Washington Center, Washington D.C. March 7, 2012 Carrie L. Giovannone, PhD Deputy Associate Superintendent Research & Evaluation. 2007-2011. AZ Learns. AZ LEARNS – Legacy 2007-2011.

E N D
AZ Learns and A-F Letter Grades Arizona Department of Education Presentation to the NCAASE Committee ASU Washington Center, Washington D.C. March 7, 2012 Carrie L. Giovannone, PhD Deputy Associate Superintendent Research & Evaluation
2007-2011 AZ Learns
AZ LEARNS – Legacy 2007-2011 • AZ LEARNS: The Law (A.R.S. §15-241) • The Department of Education shall compile an annual achievement profile for each public school. • K-8 schools • Arizona Measure of Academic Progress (MAP) • Percent of students who pass Arizona’s Instrument to Measure Standards (AIMS) • AZELLA results • High schools • Percent of students who pass AIMS • AZELLA results • Graduation rate • Drop out rate • Only valid scores (of non-mobile students) are included in. • Not included are: • Students who have taken test with non-standard modifications; • ELL students who have been in the ELL program for three years or less.
AZ LEARNS Profiles • Labels are based on a scale: • Excelling • Highly Performing • Performing Plus • Performing • Failing to meet academic standards • Underperforming
General Process to Calculate an Achievement Profile • Calculate status (percent passing) on AIMS • School improvement points using AIMS scores • Calculate scale score points for MAP (Grades 4-8) • Proficiency on Arizona’s English Language Learner Assessment (AZELLA) • Calculate scale score points for graduation rate (High Schools only) • Calculate scale score points for dropout rate (High Schools only) • AYP point for “meeting” status (used through 2008) A profile label was determined for a school, based on the above criteria.* *Schools that achieved points qualifying for a “Highly Performing” or “Excelling” rating would have to meet an additional criterion – a requisite percentage of students reaching the “exceeding” proficiency level on the state standard. If this criterion was met then the school earned a label of “Highly Performing” or “Excelling.”
i. Status Points • Points were attributed to schools based on the percent of students passing AIMS High School • Best AIMS score for students in grades 10-12
ii. School Improvement Points • For every Grade/Subject, the calculation was the difference between the percentage of students that scored at the “Falls Far Below the standard” proficiency level on AIMS from percent passing AIMS (“Meets or Exceeds”). • This was calculated for four prior years of test scores and a year-to-year change was computed. • The average of the year-to-year change was calculated. • This average for each Grade/Subject was given points.
School Improvement Calculation Growth Measure is the average of Year-to-Year Change = 5.3 (points would be given to this grade/subject for a school based on this average)
Status & School Improvement Points • For each Grade/Subject the points from the status calculation and the school improvement calculation are added together with a weight of .70 for the highest point value (i.e., either status or improvement) and a .30 for the lower point value. • If a school does not have past year data then the status points of the current year are weighted by 1.00. • The points from the combination of Status and School Improvement are averaged across grades by subject and attributed to the school for an overall point value. (This point value is added to additional performance criteria).
Status & School Improvement + Grade/SubjectStatusPoints Grade/Subject Points (1-6) Grade/Subject Improvement Points = Grade/Subject Points (1-6) Grade/Subject Points (1-6) Averaged across grades for an overall School Status and School Improvement Point value Grade/Subject Points (1-6) Grade/Subject Points (1-6)
Students included in the calculations: • Students with a valid test score • Students who did not receive an alternate accommodation • ELL students that were in the ELL program for 4+ years • Full academic year (FAY) students – enrolled in the first 10 days of the school calendar year and was continuously enrolled through testing day Missing Data Schools missing AIMS data for any Grade/Subject received zero points for that particular Grade/Subject. Small Number of Students in Grade Grade/Subject combinations with less than 10 students were not evaluated and received zero points for that particular Grade/Subject. Small Schools The upper bound of a 95% confidence interval on AIMS scores was used for small schools for each Grade/Subject with less than 16 students.
iii. MAP Calculation • An individual expectation of one year’s growth (i.e., regression using average year’s growth for a particular grade, prior year AIMS score and FAY indicator as factors) is calculated for each student and subject. • The expectation of one year’s growth is subtracted from the actual growth achieved by the student to determine a Growth Index. • The average Growth Index for school is calculated by averaging Growth Indices for individual students across all grades and subjects. • Points were awarded for the growth index by a weighted regression formula.
MAP – Special Cases • Only calculated for grades 4-8 • Schools were excluded if they did not have a grade evaluated for MAP • Schools were excluded if they had less than 16 students in the MAP analysis • The MAP formula was adjusted in 2009 after AYP was removed from AZ LEARNS.
v. Graduation Rate • Schools were excluded from the calculation until it served Grade 12 for two years. • Schools were excluded if there was a minimum cohort size of 15 • The schools excluded from graduation rate points based on either of the two criteria above were awarded double points for drop out rate decrease.
vi. Dropout Rate • Schools were excluded if the dropout rate was less than 15 students • The schools excluded from dropout rate points based on the criterion above were awarded double points for graduation rate increase.
Excelling and Highly Performing School Criteria For a school to be identified as “Highly Performing” or “Excelling,” a school must have a certain adjusted percentage of students that exceeded the standard on the AIMS. The profile examines the higher of: • An average of the past three years • The current year If a school was designated as a “Highly Performing” or Excelling” school from the AZ LEARNS formula but did not meet this threshold then the school received a “Performing Plus” label. This criteria was not applied if schools had less than 16 students with valid test scores. In this case, the school received their school profile from the AZ LEARNS formula.
2011-present A-F Letter Grade
Senate Bill 1286A-F Accountability: Grades K-8 Measures from SB 1286 to include at the School, LEA, and State levels: • Percent of students who met or exceeded on the AIMS • Student Performance on AIMS • Student mobility adjustments • Distribution of achievement at each school and LEA • Longitudinal indicators • ELL test results • Annual dropout rate • Annual graduation rate
Senate Bill 1286A-F Accountability: Grades 9-12 Measures from SB 1286 to include at the School, LEA, and State levels: • Percent of students who met or exceeded on the AIMS • Student Performance on AIMS • Student mobility adjustments • Distribution of achievement at each school and LEA • Longitudinal indicators • ELL test results • Annual dropout rate • Annual graduation rate
Included in A-F Profiles • Full Academic Year (FAY) students • enrolled within the first ten days of the school’s calendar year and continuously enrolled up until the date of testing • Students with a valid test score • Students that have, at minimum, a test score for the two most recent school years (i.e., FY10 and FY11) • The five most recent years of AIMS Reading and Mathematics scale scores were used in the calculation for the growth percentile
Components of the New Profile Growth Score 50% Composite Score 50% Composite Score + Growth Score = A-F Accountability Profile
Composite Score Percent Passing AIMS • Percent Passing AIMS in current year (2011) • FAY students who met and exceeded the AIMS Reading and Mathematics • The High School calculation includes the better of spring / fall AIMS results for FAY students in grades 10, 11, and 12 • Worth 0-100 points
Composite Score 5-year Graduation Rate • Baseline Year is 2007 or the school’s first year serving grade 12, whichever is the latest • The graduation rate from the year prior is used in the profile (i.e., 2010 grad rate was used for 2011 A-F profile )
Composite Score DropoutRate A school will not be evaluated on dropout rate if it has less than 15 students in the school
Composite Score The composite score is 50% of the A-F Accountability Profile
Growth Model • This is a replication of the Colorado Growth Model (also adopted by Georgia, Indiana and Massachusetts). • Percentile Ranks (1-99) are used to calculate student growth percentiles comparing students to their academic peers with the testing history. • Model uses a curvilinear regression line to more accurately represent student growth (i.e., quantile regression with b-spline smoothing).
Growth Score • A percentile rank is computed for Reading and for Mathematics separately. The medians from these two rankings are averaged for an “all student” rank (1-99). • The bottom quartile from the “all student” rank is identified and a median growth percentile for this group is indicated for each school(1-99).
A-F Accountability Scores The composite and growth scores are added together to determine the grade earned based on the score differentiations in the table below. • At the LEA Level, aggregate scores are used from all of their qualifying schools.
What the data can tell us… Student Growth Percentiles (SGP) answers the question of: “How well are our students scoring in relation to the scores of other students in the state?” Composite side answers the question of: “How many students are meeting or exceeding the standard?”
Anticipated Additions for 2012 • Adjustments to the A-F Letter Grade model* • ELL Criteria adjustment • Addition of AIMS A incorporated • Parallel achievement profiles* will be calculated for: • Alternative schools • Extremely Small Schools • K-2 * Contingent on AZ State Board approval in Spring 2012
Growth-to-Standard ADE will be incorporating the GTS for each general education student across the state in Spring 2013.
Timeline AZ Accountability SY2012 – Adjustments to A-F, Parallel Models, new School Improvement designations (Reward, Focus and Priority schools) SY2013 – Growth to Standard for individual general education students SY2014 – New AZ Standards (i.e., Common Core) operationalized across all grades SY2015 – New AIMS assessment (i.e., PARCC) NCAASE – Special Education Grant February 2012 – State Board approval Spring 2012 – Initial data released July 2012 (ongoing every July) – Current data released
Questions Arizona Department of Education, Research & Evaluation Dr. Carrie L. Giovannone Deputy Associate Superintendent Carrie.Giovannone@azed.gov