Download
1 / 25
250 likes | 412 Views
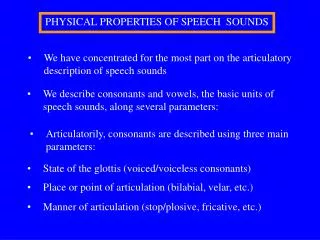
The phonetics of Tyneside speech: a diachronic study of the 'goat vowel’ /o ː/. Hermann Moisl, Karen Corrigan, Isabelle Buchstaller, Adam Mearns Newcastle University, UK. Introducton.

E N D
The phonetics of Tyneside speech: a diachronic study of the 'goat vowel’ /oː/ Hermann Moisl, Karen Corrigan, Isabelle Buchstaller, Adam Mearns Newcastle University, UK
Introducton The Newcastle Electronic Corpus of Tyneside English (NECTE) includes phonetic transcriptions of 64 audio interviews recorded in the Tyneside region of north-east England by the Tyneside Linguistic Survey (TLS) in the late 1960s. Moisl et al 2006 and Moisl & Maguire 2008 abstracted phonetic usage profiles for each of the 64 speakers from these transcriptions, and cluster analyzed them to see if any regularities could be found on the basis of which hypotheses about phonetic variation in the Tyneside region could be framed. Such regularities were found, and the hypotheses were (i) that there was systematic variation in phonetic usage among Tyneside speaker groups , (ii) that a small number of phonetic segments accounted for most of this variation, and (iii) that the primary determinant of the variation was gender.
Introduction The present paper extends these hypotheses by studying the distribution of the variants of the so-called ‘goat vowel’ /o:/, which represent much of the phonetic variation among the TLS speakers, across speaker groups in more recent Tyneside speech corpora. It is intended both as a contribution to our understanding of the historical development of the Tyneside dialect, and, in combination with the 2006 and 2008 papers, as a methodological case study in the use of cluster analysis for hypothesis generation in diachronic dialectology. The discussion is in four main parts: • the first part briefly reviews the 2006 and 2008 papers that generated the above hypotheses, • the second describes the more recent corpora to be used, • the third reports the methodology and results of the present study, • and the fourth relates these results to existing work on the goat vowel.
1. Outline 0f 2006 / 2008 papers Cluster analysis is a family of mathematically-based computational methods for identification and graphical display of structure in data where the data is too large either in terms of the number of variables or of the number of objects described, or both, for it to be readily interpretable by direct human inspection. It has long been used for this purpose in applications like hypothesis generation, hypothesis confirmation, and dimensionality reduction across a broad range of science and engineering disciplines. In corpus-based linguistics it is useful mainly at the initial stages of research, particularly where the language or the linguistic phenomenon of interest is not well understood, as a way of discovering theoretically-interesting structure in data abstracted from corpora which can then be used to generate linguistic hypotheses.
1. Outline 0f 2006 / 2008 papers The Tyneside Linguistic Survey saw the potential of cluster analysis for corpus-based sociolinguistic and dialectological research at a time when its application in the so-called ‘hard’ sciences together with the underlying mathematical theory were in their infancy, and the computational technology necessary for its implementation was just barely up to the task. The research question the TLS team asked was: Is there systematic phonetic variation in the Tyneside speech community, and, if so, does that variation correlate systematically with social variables? In contrast to the then-universal and even now dominant feature-centric approach to variationist research, the cluster-based approach proposed a fundamentally empirical methodology in which salient factors were extracted from corpus data and then served as the basis for hypothesis generation.
1. Outline 0f 2006 / 2008 papers To this end, a phonetic transcription scheme analogous to the IPA was defined , and samples of the audio interviews were transcribed using that scheme. These phonetic transcriptions were then cluster analyzed and correlated with speaker-specific social data associated with the interviews with a view to deriving and relating to one another the most important linguistic and social determinants of linguistic variation in the Tyneside area. The remainder of this section briefly outlines the development of the TLS methodology by members of the teams that created NECTE and DECTE . The discussion is in two main parts: the first part deals with data abstraction from these corpora, and the second with the theory and application of cluster analysis to that data.
1. Outline 0f 2006 / 2008 papers: data The TLS component of NECTE includes 64 phonetic transcriptions of about 10 minutes of each of the 64 audio recordings. The data representing a single transcription is a 156-element vector t each of whose elements represents a different phonetic segment in the TLS transcription scheme, and the value at any given element tj (for j = 1..156) is the frequency of occurrence of segment j in the transcription. The vector t is taken to be a description of the phonetic usage of the speaker corresponding to the transcription.
1. Outline 0f 2006 / 2008 papers: data The set of speaker vectors was assembled into a matrix M in which the rows i (for i = 1..n, where n is the number of speakers) represent the 64 speakers, the columns j (for j = 1..156) represent the phonetic segment variables, and the value at Mi,j is the number of times speaker i uses the phonetic segment j, as shown below. This matrix was the basis for the TLS phonetic analysis and remains so in the more recent work described in what follows; it was transformed prior to analysis to compensate for variation in interview length and to reduce dimensionality.
1. Outline 0f 2006 / 2008 papers: cluster analysis As noted, cluster analysis is a family of computational methods for identification and graphical display of structure in data when the latter is too large either in terms of the number of variables or of the number of objects described, or both, for it to be readily interpretable by direct inspection. All these methods work by partitioning a set of objects in the domain of interest into disjoint subsets in accordance with how relatively similar those objects are in terms of the variables that describe them. The objects of interest here are speakers, and each speaker's phonetic usage is described by a set of variables. Any two speakers' phonetic usage will be more or less similar depending on how alike their respective variable values are: if the values are identical then so are the speakers in terms of their phonetic usage, and the greater the divergence in values the greater the differences in usage. Cluster analysis of the foregoing data groups the 64 TLS speakers in terms of how similar their frequency of usage of 156 phonetic segments is.
1. Outline 0f 2006 / 2008 papers: cluster analysis The resulting tree was the basis for the hypothesis that phonetic variation among speakers in the Tyneside community of the late 1960s was non-random. This was supplemented in two ways. On the one hand, the clusters were correlated with social data about their members, with the following results: • The speakers from Newcastle on the north side of the river Tyne (NG2) are strongly differentiated from the Gateshead speakers on the south side (NG1). • The Gateshead speakers NG1 subcluster primarily by gender, with NG1b consisting entirely of males and NG1a consisting predominantly of females, with NG1a(i) entirely female and NG1a(ii) containing a mixture of male and female speakers.
1. Outline 0f 2006 / 2008 papers: cluster analysis On the other hand, the primary phonetic determinants of the cluster structure were identified by constructing summary descriptions of the phonetic characteristics of the speakers in each cluster and then comparing them. The summary descriptions were cluster centroids, where a centroid is just the mean of a set of vectors , as below.
1. Outline 0f 2006 / 2008 papers: cluster analysis The centroids for each of the clusters were calculated and the differences among them identified by comparison. The plot shows a selection of the segments in which NG1 and NG2 differed most.
1. Outline 0f 2006 / 2008 papers: cluster analysis According to the plot, the six phonetic segments most important in distinguishing cluster NG1 from NG2 are three varieties of [ə], [o:], [I], and [eI]: • The Newcastle speakers characteristically use Ə1 and Ə2 whereas the Gateshead speakers use them hardly at all . • The Gateshead speakers use Ə3 much more than the Newcastle speakers, • and so on. The subclusters of NG1 can be examined in the same way and the hypothesis thereby further refined.
2. The more recent corpora To follow the results of the foregoing analyses through to the present day, two corpora more recent than the Tyneside Linguistic Survey (TLS) are used in what follows. • 1991-94 Phonological Variation and Change (PVC) corpus (Milroy, Milroy and Docherty): 18 digital audio interviews, up to one hour in length, with self-selected dyads of friends or relatives, matched in terms of age and social class, who had freedom to converse on a wide range of subjects with minimal interference from the fieldworker. Gender, age and broadly defined socio-economic class of the participants were included. • (2007 – current) Newcastle Electronic Corpus of Tyneside English 2 (NECTE2)(Corrigan & Buchstaller): Digitized audio recordings and orthographic transcriptions of dyadic interviews, together with records of informant social details and other supplementary material, collected by undergraduate and postgraduate students and researchers at Newcastle University.
3. The ‘goat’ vowel /o:/: methodology and results The aim of this study, as noted, is to extend the hypotheses framed with respect to the 1960s TLS phonetic data in Moisl et al 2006 and Moisl & Maguire 2008 by examining the distribution of the variants of the goat vowel /o:/ across Tynesidespeaker groups from the 1960s to the present day, as represented respectively in the TLS, PVC and NECTE2 corpora. The goat vowel was selected for study because: • It is one of the segments identified in the 2006 / 2008 studies as generating much of the phonetic variation among the late 1960s speakers in the TLS. • It has been studied by researchers using methodologies different from ours (Watt & Milroy 1999, Watt 1999, 2000, 2002), which enables comparison of our results with theirs.
3. The ‘goat’ vowel /o:/: data Four variants of /o:/ occur with sufficient frequency in the TLS, PVC, and NECTE2 corpora to be worth studying: [o:], [oʊ], [a:], and [ʊə]. The frequencies of these variants in the three corpora were abstracted as follows. TLS The frequencies for all four variants were extracted from the full TLS phonetic frequency matrix M presented earlier. • The seven Newcastle speakers corresponding to cluster NG2 the cluster tree are not included for reasons we can discuss later. • The result is a 57 x 4 matrix MTLS in which each row represents a Gateshead speaker, each column represents one of the /o:/ variants, and the value at MTLS(i,j) is the number of times segment j occurs in interview i, for i = 1..57 and j = 1..4. A fragment of this matrix is shown below.
3. The ‘goat’ vowel /o:/: data PVC A 16 x 4 data matrix MPVC with the same format as the one just shown for TLS was abstracted from 16 PVC audio interviews by listening to and counting the frequencies of each of the /o:/ variants. NECTE2 The same was done for 16 randomly-selected NECTE2 interviews, yielding the 16 x 4 matrix MNECTE2.
3. The ‘goat’ vowel /o:/: cluster analysis The row vectors of each of the three matrices MTLS, MPVC, and MNECTE2 were cluster analyzed and, in each case, the cluster structure was correlated with a selection of social data associated with the speakers in the corresponding corpus.
3. The ‘goat’ vowel /o:/: cluster analysis MTLS The tree contains three main clusters. Examination of the social data associated with their respective members shows that that the primary correlation of GOAT realisation is with gender: • A consists almost exclusively of females, • B.1 almost exclusively of males, • B.2 is mixed male and female. To see what differentiates these clusters from one another, centroids were constructed for each of clusters A, B, B.1 and B.2 and then compared.
3. The ‘goat’ vowel /o:/: cluster analysis Centroids for clusters A and B The predominantly female cluster A shows a strong preference for the [o:] variant as against the remaining speakers whose distribution is more evenly spread across all the variants, though with a preference for [a:]. Centroids for clusters B1 and B2 There is a preference by the mixed male / female cluster B.2 for [o:], while the male cluster B.1 again shows a preference for [a:].
3. The ‘goat’ vowel /o:/: cluster analysis MPVC The PVC speakers cluster very strongly by gender – even more so than the TLS. There are only two main clusters, each of which contains uniquely male or female speakers respectively. To see what the basis for the clustering is, centroids for clusters A and B were constructed and compared. As for the TLS, female speakers show a strong preference for [o:]. Male speakers are split between [o:] and [ʊə]. They also display a slight preference for [oʊ] and [a:] , which are little used by either group.
3. The ‘goat’ vowel /o:/: cluster analysis MNECTE2 As in the corpora before them, the NECTE2 speakers also cluster very strongly by gender. Indeed, this cluster tree looks very much like the one for the PVC: there are two main clusters clearly separated by gender. In the centroid comparison for clusters A and B, females once again strongly favour [o:], and males are spread among [o:], [a:], and [ʊə], with a preference for [a:], but [oʊ] has effectively disappeared.
4. Relation to previous work The PVC corpus described above has previously been the focus of research by Watt and Milroy (Watt and Milroy 1999; Watt 1999, 2000, 2002). This involved examining the distribution of phonetic variants, including those of the GOAT vowel, in the speech of 32 PVC informants who were evenly divided into eight groups of four speakers on the basis of gender, age (younger speakers, 16-25 years old, and older speakers, 45-65 years old) and a broadly defined notion of social class (Watt & Milroy 1999: 26-27; Watt 2000: 76-77). In the analysis of the GOAT vowel, four variants were identified as significant: [o:], [ʊə], [ɵ:] and [oʊ].
4. Relation to previous work As with our analysis, the frequencies abstracted from the PVC corpus by Watt and Milroy clearly point to a very strong preference for [o:] among female speakers. This is identified as the ‘generic northern’ variant (Watt 2000: 82) which is the ‘default’ or ‘unmarked’ realization in Tyneside English (Watt & Milroy 1999: 32, 36). Its status as such is perhaps reinforced in Watt and Milroy’s results by the fact that, while the frequency is noticeably lower for males than for females, it is nevertheless the most common variant also among male speakers.
4. Relation to previous work The most obvious difference between the current analysis and that of Watt and Milroy is as follows. Of the four variants identified as frequent enough for inclusion in the present study, the two monophthongs are [o:] and [a:]. In Watt and Milroy’s analysis of PVC speakers, they are [o:] and the central variant [ɵ:]. Watt (2002: 47) notes that other variants, including [a:], were considered, but their infrequency led to them being omitted. Like [ʊə], the monophthong [ɵ:] is identified as a male form which is in decline (Watt 2000: 83, 86). However, the relatively high frequency of its use by younger middle class males leads Watt to conclude that [ɵ:] may be a variant that this group adopts as ‘an assertion of local identity’, a recognizable north-eastern form that escapes the ‘stigma of old-fashionedness that may be attached to [ʊə]’ through its association with older working-class men (Watt 2000: 95; see also Watt 2002: 57). Though occurring with only low frequency in the PVC results (Figure 12), [a:] can be seen to share some of these characteristics with [ɵ:]. It is also consistently more frequent among male speakers and, after an apparent fall in frequency from TLS to PVC, demonstrates a rise from PVC to NECTE2 that may reflect its revitalization as a sign of local identity, especially in certain well-established lexical items, such as know, which has the traditional eye dialect spelling knaa.