Download
1 / 25
250 likes | 460 Views
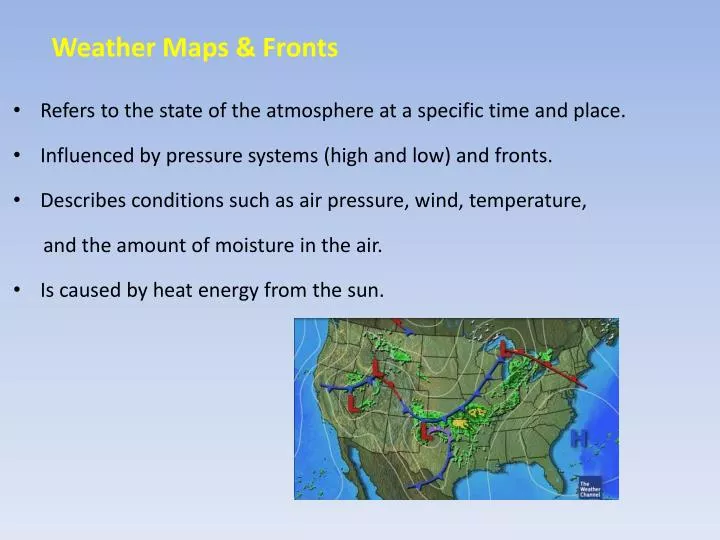
Weather Maps & Fronts. Refers to the state of the atmosphere at a specific time and place. Influenced by pressure systems (high and low) and fronts. Describes conditions such as air pressure, wind, temperature, and the amount of moisture in the air.

E N D
Weather Maps & Fronts • Refers to the state of the atmosphere at a specific time and place. • Influenced by pressure systems (high and low) and fronts. • Describes conditions such as air pressure, wind, temperature, and the amount of moisture in the air. • Is caused by heat energy from the sun.
Weather Patterns Air mass • Large body of air that has the properties similar to the part of Earth’s surface over which it develops. • Changes in weather result from movement of air masses.
Low Pressure System When air is heated, it becomes less dense • Therefore, it rises, leaving behind an area where there is less air. • Called a low pressure area • Rising air carries moisture with it. As a result, low pressure is usually associated with clouds and rain. • Indicated by a L on a weather map. • Troughs of low pressure are important because they sometimes lead to the development of a low pressure system. Troughs are indicated by lines (sometimes purple, black or green) with no triangles or semicircles.
High Pressure System As air cools, it becomes more dense • It falls, creating an area where there is more air • Called a high pressure area • Very little moisture in this air, so usually associated with clear, sunny days. • Indicated by a H on a weather map.
Isobars Lines that connect points of equal atmospheric pressure. Isobars close together mean high wind. Isobars far apart mean light wind. Isotherms (iso – same, therm – heat) Lines that connect locations of equal temperature.
Front • A boundary between two air masses of different density, moisture or temperature • Cloudiness, precipitation and storms may occur at frontal boundaries • Four types of fronts: cold, warm, occluded and stationary
Cold fronts • Cold front – shown on a map as a blue line with triangles • Occurs when colder air advances toward warm air. • Cold air wedges under the warm air • This lifts the warm air, cools it and clouds form. • If the temperature difference is large, thunderstorms and tornadoes may form
Warm fronts • Warm fronts form when lighter, warmer air advances over heavier, colder air. • Shown as a red line with red semicircles.
Occluded fronts • Involves three air masses of different temperatures – cold, cool and warm • Shown on maps as purple lines with triangles and semicircles. • Colder air forces the warm air upward, closing off the warm air from the surface.
Stationary Front • Occurs when a boundary between air masses stops advancing. • May remain in the same place for several days, producing light wind and precipitation. • Shown on map as alternating red and blue line. Red semicircles point toward the cold air and blue triangles point toward the warm air.
Severe Weather • Sinking rain - cooled air and strong updrafts of warmer air cause the strong winds associated with thunderstorms. • Hail also may form as ice crystals alternately fall to warmer layers and are lifted into colder layers • May cause flooding, flash floods, strong winds
Thunderstorms – occur in warm moist air masses and along fronts. • Winds stronger than 89km/hour – severe thunderstorm.
Severe Weather • Lightning - Inside a cloud, liquid and ice particles collide causing the buildup of an electrical charge. When the charge becomes large enough, it creates a “spark” that allows the electrons to move. The current flows between regions of opposite electrical charge. Lightning can occur within a cloud, between clouds or between the cloud and the ground.
Thunder • Results from the rapid heating of air around a bolt of lightning. • The extreme heat of lightning causes the air around the lightning to expand rapidly. Then it cools quickly and contracts. • The rapid movement of the molecules form sound waves
Tornado • A violent, whirling wind that moves in a narrow path over land. • Wind moving in different directions (shearing) creates a rotating column • Ranked on the Fujita scale according to how much damage occurs F0, F1, F2, F3, F4, F5
Severe Weather • Hurricane – the most powerful storm • Large swirling low pressure system that forms over the warm Atlantic ocean • Must have winds of at least 119 km/hour • Called typhoons in the Pacific and cyclones in the Indian Ocean. • Lose power when they reach land. • The Saffir-Simpson Hurricane Wind Scale is a category 1 to 5 rating based on wind speed.
Hurricane Hurricane
Severe Weather • Blizzards – winter storm with winds over 56 km/h, low temperature, visibility less than 400m, with falling or blowing snow. • These conditions must persist for more than 3 hours. 10 min
Severe Weather Safety • Weather Advisories - are sort of in between a WATCH and WARNING. The expected weather condition has a pretty good chance of occurring, even a likely chance of occurring, but typically an advisory is used for “less” severe type of weather conditions. • Severe weather watch – when conditions are favorable for severe weather. • Severe weather warning – severe weather already exists.