Download
1 / 44
440 likes | 544 Views
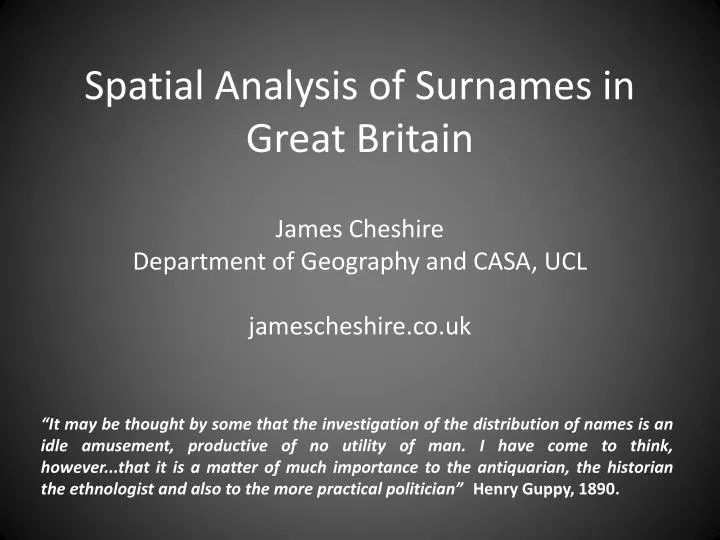
Spatial Analysis of Surnames in Great Britain. James Cheshire Department of Geography and CASA, UCL jamescheshire.co.uk.

E N D
Spatial Analysis of Surnames in Great Britain James Cheshire Department of Geography and CASA, UCL jamescheshire.co.uk “It may be thought by some that the investigation of the distribution of names is an idle amusement, productive of no utility of man. I have come to think, however...that it is a matter of much importance to the antiquarian, the historian the ethnologist and also to the more practical politician” Henry Guppy, 1890.
Outline • Surnames in Great Britain*. • Surnames and Geography. • Research aims. • Surnames and Genetics. • Unearthing Great Britain’s surname regions. • Effects of scale. • 2 interesting examples. • Surname regions in Great Britain? • Future research. * I will be talking about every surname registered in Great Britain. The majority would have originated in Britain; these remain the dominant driver of surname regions and will therefore be the focus of the contextual information that follows. When I refer to Great British surnames I am, however, referring to those registered, not necessarily those originating in Britain.
What are surnames in Great Britain? • In 1066 the Normans “brought with them a new, upper class fashion for surnames” (Miles, 2005). • Main purpose was to clarify the right to ownership of land. • Indicated family place of origin in France or land acquired in England.
What are surnames in Great Britain? It took around 300 years for surnames to be widely adopted, with people taking naming inspiration from every aspect of their lives:
What are surnames in Great Britain? - With greater recording of the population (starting with the Domesday book of 1085) surnames became patronymical (inherited from the father). • They became fixed to a family lineage rather than location and could move with their “owners”. • Many names originated in only one place/ region due to different conventions throughout Britain.
Surnames and Geography Is it the case that these places of origin remain the areas of highest concentration for these names? ...or over the 1000 years since surnames arrived in Britain has population movement (including international migrants) caused spatial mixing of surnames?
Surnames and geography- some examples: individual surnames Smith Lewis Macleod Buckley
Surnames and geography- some examples: groups of surnames Genitival “s” names Patronymic/ Metronymic Names Source: Schurer, K. 2004
Surnames and Geography -The surnames of Britain appear to exhibit a clear geography. • This presents an interesting regionalisation problem. • It also has broader cultural significance.
Aims - Aggregate the multiple surname distributions to establish broad regional variations. - Undertake the first study of this kind on two “complete” population registers. • Establish the extent to which the derived regions are genetic/ cultural. • Develop a methdological framework for the future spatial analysis of names. • Demonstrate the inherently spatial nature of surnames and their utility as a resource.
Data 1881 Census 29 Million People 425, 793 Surnames 345, 781 <10 occurrences Principle level of geography: 657 Registration Districts 2001 Enhanced Electoral Roll 45.6 Million People 1,597, 805 Surnames 1,457, 681< 10 occurrences Principle level of geography: 410 Districts* (excl. N.Ireland) Additional analysis on: approx 10650 Wards (inc. N.Ireland) * In the analysis the 32 London Boroughs have been aggregated to a single district (leaving 379 districts) as their high dissimilarity in comparison with the rest of Britain and each other was distorting the results of the regionalisation.
1881 Surname Frequencies (top 500 names) 2001 Surname Frequencies (top 500 names)
Genes and Surnames - If surnames are inherited then they behave much like a genetic attribute. - Obviously only really works for men (unless women keep their maiden names).
Genes and Surnames King and Jobling, 2009
Genes and Surnames - Previous diagram does not account for geography (the surname possessors could live anywhere). - The fact that many surnames have stayed concentrated in their point of origin suggests that the groups of people possessing them haven't moved much. • They are therefore even more likely to be related.
Isonymy (“same name”) • Concept forms the basis to this analysis. • George Darwin (son of Charles) was interested in isonymous marriages. • His perspective was a genetic one. He wanted to quantify the effects of inbreeding between cousins*. * His father and mother were cousins so he had a vested interest!
Coefficient of Isonymy “The probability of members of two populations or subpopulations having genes in common by descent as estimated from sharing the same surnames” (Lasker, 1985:142). where Si1is the number of occurrences of the ith surname in a sample from Area 1 and Si2 is the number of occurrences from the same surname from Area 2. The resulting values can be considered as the proportional correspondence in terms of a shared surname pool between a particular place and all others in the country .
A Coefficient of Isonymy Cheshire Penny Lewis Whitfield Longley Cheshire Penny Lewis Buckle Dolan Evans Mateos Adnan Cheshire Longley Buckle Dormandy Singleton Evans O’Brien Longley Smith O’Brien Dormandy Pope Rohde Mateos Smith B Singleton Pope Mateos O’Brien Evans Richards Rohde Johns Rohde Adnan Evans Adnan Lewis Buckle Penny Singleton Mateos Smith O’Brien C Dormandy Singleton Longley Lewis Smith Adnan Dormandy Richards Penny Dolan Rohde Cheshire Whitfield Johns Buckle Take Cheshire from A, probability of removing Cheshire from: Take Mateos from B, probability of removing Mateos from: B= 1 in 17 C= 1 in 17 A= 2 in 20 Take Johns from C, probability of removing Johns from: C= 1 in 17 A= 0 B= 1 in 17 Repeat this process for each name and sum the probabilities for each comparison...
Coefficient of Isonymy A Whitfield Cheshire Penny Lewis Longley Dolan Evans Adnan Cheshire Buckle Smith Singleton Evans O’Brien Longley Dormandy Dormandy Mateos Mateos Smith B Singleton O’Brien Richards Rohde Lewis Johns Adnan Mateos Smith O’Brien C Singleton Longley Lewis Adnan Dormandy Richards Penny Dolan Rohde Cheshire Whitfield Johns Buckle Coefficient of isonymy between districts A, B and C:
Lasker Distance • This takes the Coefficient of Isonymy values and does the following: • Turns them from very small numbers to larger ones. • Inverts them so that smaller values represent greater similarity (rather than greater difference). where L is the Lasker distance and i and j are two separate populations
Lasker Distance Matrices 1881 Matrix 2001 Matrix Yarmouth Yeovil York Aberayron 6.389540 6.289929 6.438361 Aberdeen 6.356152 7.019357 6.213222 Abergavenny 6.412893 6.361753 6.566717 Aberystwith 6.327093 6.319481 6.467985 Abingdon 6.353814 6.559106 6.621873 95Z 99ZZ OOLN 00BL 7.520982 7.336616 7.219516 00BM 7.428889 7.315671 7.425037 00BN 7.347616 7.356772 7.394888 00BP 7.452982 7.299915 7.330886 00BQ 7.410027 7.300150 7.387787 Can be thought of as placing the districts in “surname space”.
Analysing the Lasker Distance Matrix The purpose is to group/ split the data by surname similarity. - Clustering - Multidimensional Scaling District i or j Lasker’s Distance
Clustering: K-Means • - The K-means algorithm randomly allocates a set of k seeds within the data matrix and then allocates all data points to their nearest seed. • - A new mean cluster centroid is then calculated for each cluster, and a new partitioning of the data points is made based on the new nearest centroid. • - Centroids are then recalculated for the new clusters, and the algorithm repeats these steps until no more switching takes place.
Clustering: Ward’s Hierachical Clustering - Considers union of every cluster pair. - The two clusters with the minimum increase in ‘information loss’ are combined. - Information loss is defined by Ward in terms of an error sum-of-squares criterion.
Ward’s Hierarchical Clustering 1881 2001
Ward’s Hierachical Clustering 1881 2001
Ward’s Hierarchical Clustering (K=15) 2001 1881
Multidimensional Scaling 1881 2001
Summary • There is undoubtedly a regionalisation to Great British surnames. • The underlying causes appear to be cultural rather than explicitly environmental: i.e. surname dissemination does not appear to be related to topographic barriers. • The Scotland/ England transition is a lot more discrete than the Wales/ England transition. - To what extent is this patterning an artefact of the spatial units used in the Lasker Distance calculations...?
Higher Resolution Analysis - Does calculating the Lasker Distance between smaller areas create a different picture of the surname regions in Britain? - Is small scale variation sufficient to mask broader trends/ effects? - These questions are explored with 2001 CAS Wards. - Some considerations: - Data size: at Ward level the Lasker Distance calculation involves 1,597, 805 *10500*10500 cells of data. - Small numbers problem - Key advantage is the reduced influence of London (accounts for only 6% of the units of analysis instead of 13%). It can therefore be included in the cluster analysis.
Corby 1881 2001 MDS Ward’s K-Means
Corby • - In 1932 Stewarts and Lloyds built a new iron and steel works in Corby. • - Labour sourced from closing Scottish steelworks, mainly in Lanarkshire. • - Into the 1970s, 50% of the incoming population Scottish. • - Transformed population from 1,500 to 34,000 . • - Annual Highland Games. 1881 2001 MDS Ward’s K-Means
Danelaw 1881 2001 Ward Level 2001
Surname Regions Great Britain? “It might appear...that the family of nomenclature of Englishmen was for the most part in a confused jumble, and that on account of the rapid means of inter-communication, which we enjoy in the present Century, most of the distinctions that existed in the past would have been lost in the whirl and bustle of the industrial era in which we live. It might have seemed...that chance had played such as part in the intermingling of inhabitants of different counties and districts, that it would seem a hopeless task to unravel the entangled skein...I found it was yet possible to pick up the threads. By this means I have found order where I expected disorder and method where I only looked for chance. ” Henry Guppy, 1890.
Surname Regions in Britain? - Multiple levels from broad contiguous regions to small areas of intra-region similarities. - Each level representing a different slice through time? • Likely to reflect areas of genetic and cultural similarities/ difference.
Spatial Analysis of Surnames Methods Augmentation Applications Population Sampling Clustering Geodemographics Geo-Genealogy Surname Sampling Genetic Characteristics Hypothesis generation Surface Analysis Functional/ Uniform Regions? Visualisation Migration flows Temporal Analysis Temporal Analysis
Effective Population Sampling - Using surname regions to inform sample design regions of the Britain: - For example there is little point in sampling a person from Corby if you wish to genetically characterise the Northamptonshire population. - Equally, the Corby population may have unrepresentative views on Scottish devolution, for example. - Do the sub-regional groups show more allegiance to each other than the broader regions they fall within?
Conclusions • Surname regions exist in contemporary Britain. • To a remarkable degree they remain unchanged from their conception nearly 1000 years ago. • Unearthing these regions by establishing a clear methodological framework and utilising complete population registers provides a firm basis for future research.