1 / 1

Percentages

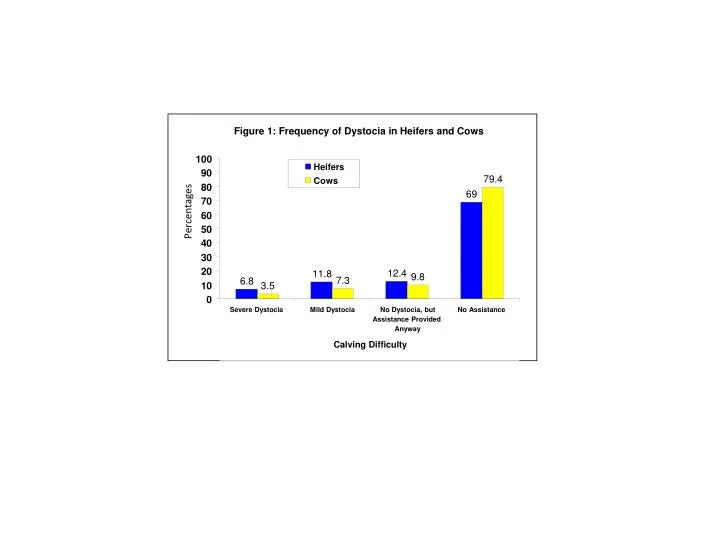
Figure 1: Frequency of Dystocia in Heifers and Cows. 100. Heifers. 90. 79.4. Cows. Percentages. 80. 69. 70. 60. 50. 40. 30. 20. 12.4. 11.8. 9.8. 7.3. 6.8. 10. 3.5. 0. Severe Dystocia. Mild Dystocia. No Dystocia, but.

wauna
Download Presentation

Percentages

An Image/Link below is provided (as is) to download presentation Download Policy: Content on the Website is provided to you AS IS for your information and personal use and may not be sold / licensed / shared on other websites without getting consent from its author. Content is provided to you AS IS for your information and personal use only. Download presentation by click this link. While downloading, if for some reason you are not able to download a presentation, the publisher may have deleted the file from their server. During download, if you can't get a presentation, the file might be deleted by the publisher.

E N D

Presentation Transcript


  1. Figure 1: Frequency of Dystocia in Heifers and Cows 100 Heifers 90 79.4 Cows Percentages 80 69 70 60 50 40 30 20 12.4 11.8 9.8 7.3 6.8 10 3.5 0 Severe Dystocia Mild Dystocia No Dystocia, but No Assistance Assistance Provided Anyway Calving Difficulty

More Related