Download
1 / 13
130 likes | 223 Views
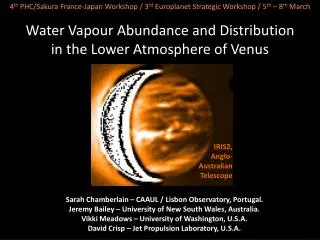
Distribution of H 2 O and SO 2 in the atmosphere of Venus Yung Y. 1 , Zhang X. 1 , Liang M.-C. 2 and Parkinson C. 3 1 California Institute of Technology 2 Academia Sinica , Taiwan 3 Univ. of Michigan. Abstract.

E N D
Distribution of H2O and SO2 in the atmosphere of Venus Yung Y.1, Zhang X.1, Liang M.-C.2 and Parkinson C.3 1California Institute of Technology 2Academia Sinica, Taiwan 3Univ. of Michigan
Abstract The large variability of H2O and SO2in the atmosphere of Venus above the cloud tops is puzzling, especially since there is little evidence for their variability in the lower atmosphere. We note three important related facts: (1) The abundances of H2O and SO2 in the deep atmosphere are of the same order of magnitude ~100 ppm, (2) there is a rapid decrease in H2O and SO2 just above the cloud tops, resulting in sharp vertical gradients in their vertical profiles, and (3) the primary removal mechanism for H2O and SO2 above the cloud tops is formation of H2SO4 aerosols. In this work we examine the possibilities that H2O and SO2 could be regulated in a chemistry-transport model.
Observation: H2O measurement • Fig. 1: Disk-average H2O mixing ratios were derived from Mm-wave spectra in the Venus mesosphere (65–100 km) (Sandor et al. 2005). The data are shown as a function of measurement date. Error bars indicate 1-sigma s/n uncertainty. Observations show that the Venus mesosphere was drier in December 2002–June 2004 than in March 1998–January 2001.
Observation: SO2 measurement • Fig. 2: Measurements of SO2 on Venus above clouds, available from 1969 up to now (see Table 2 in Belyaev et al., 2008). The SO2 content in ppb volume is considered at the level of 40 mbar (69 km of altitude).
hν SO2 SO • Fig. 3:Majorpathways for the photochemistry of SO2 above the cloud tops O, ClO hν O H2O SO3 H2SO4 hν Rise Condensation • H2SO4 Aerosol, clouds LowerAtmosphere
Chemical Model The major pathways for the photochemistry of SO2 above the cloud tops are shown in Fig. 3. SO2 exchanges rapidly with SO and SO3. However, formation of H2SO4 followed by condensation sequesters SO2 in aerosol particles and remove it from active chemistry. The reaction that forms H2SO4 appears to involve a complex with H2O: SO3 + H2O = SO3·H2O SO3·H2O + H2O = H2SO4 + H2O We adopt the expression for the rate of formation of of H2SO4 from Lovejoy et al. (1996) Note the extremely large dependence on temperature and the quadratic dependence on the concentration of H2O The model we used for this study is based on Yung and DeMore (1982) with updates from Mills (1998) and Yung et al. (2009).
Sensitivity of SO2 to transport • The vertical profile SO2 has a very sharp vertical gradient above the cloud tops due to its rapid loss by conversion to H2SO4 aerosols. Hence a change in transport (parameterized by the eddy diffusion coefficient) could result in a large change in the concentration of SO2 above the cloud tops. The standard model is given by the black curve in Fig. 4. The purple, blue and light blue curves are for models in which the eddy diffusion coefficient was multiplied 2, 3 and 10 times. Note that at higher altitudes, the changes are on the order of 100.
Fig. 4: SO2 sensitivity study to eddy mixing profiles. Different color refers to different eddy diffusion profile. Squaresindicatethe observations.
Sensitivity of H2O to the lower boundary (at 58 km) • H2O is removed above the cloud tops by formation of H2SO4. As a result, the vertical profile of H2O falls with height in the standard model (Fig. 5, red curve), where the H2O at the lower boundary is 100 ppm. As we decrease the H2O at the lower boundary to 80 and 70 ppm, there is corresponding decrease in the H2O higher up (green, light blue). As the H2O concentration at the lower boundary is further lowered to 65 and 60 ppm, there is a sudden falloff of the H2O above 70 km. The reason is the complete sequestration of H2O by H2SO4 aerosols. Thus, H2O could exhibit a bifurcation as its value falls below a critical value.
Fig. 5: H2O sensitivity study for lower boundary conditions. Different color refers to different H2O content in the bottom.
Conclusion • SO2 and H2O can regulate each other via formation of H2SO4 • Small changes in the transport rates for SO2 may result in large changes in SO2 above the cloud tops • Below a critical value, H2O could be completely sequestered by H2SO4 aerosols • The combination of the above could explain some of the observed variabilities in SO2 and H2O on Venus
Acknowledgements • We acknowledge support by NASA and we thank B. Sandor and J.-L. Bertaux for helpful discussions and J. Weibel for modeling assistance.
Reference • Belyaev, D., O. , et al. 2008, First observations of SO2 above Venus’ clouds by means of Solar Occultation in the infrared, J. Geophys. Res., 113, E00B25, doi:10.1029/2008JE003143. • Bertaux, J.-L., et al. 2008, SPICAV/SOIR on board Venus Express: An overview of two years of observations, paper presented at 37th COSPAR Scientific Assembly, Montreal, Canada, July 13– 21. • Lovejoy E. R., Hanson D. R., and L. G. Huey L. G. 1996, Kinetics and Products of the Gas-Phase Reaction of SO3 with Water, J. Phys. Chem. 100, 19911 • Mills, F.P. 1998, I. observations and photochemical modeling of the Venus middle atmosphere. II. thermal infrared spectroscopy of Europa and Callisto. Ph.D. dissertation, California Institute of Technology, Pasadena, CA, 366pp. • Sandor, B. J., and R. T. Clancy 2005, Water vapor variations in the Venus mesosphere from microwave spectra, Icarus, 177, 129– 143. • Yung, Y. L., and W. B. DeMore 1982, Photochemistry of the stratosphere of Venus: Implications for atmospheric evolution, Icarus, 51, 199– 247, doi:10.1016/0019-1035(82)90080-X. • Yung, Y. L., et al. 2009, Evidence for carbonyl sulfide (OCS) conversion to CO in the lower atmosphere of Venus, J. Geophys. Res., 114, E00B34, doi:10.1029/2008JE003094.

![[SO 2 + H 2 O H 2 SO 3 ] SO 3 + H 2 O H 2 SO 4 CO 2 +H 2 O H 2 CO 3](https://cdn2.slideserve.com/4275035/slide1-dt.jpg)