Download
1 / 30
350 likes | 613 Views
Software Metrics. Objectives. Understand why measurement is important Understand the basic metrics approaches used in industry Know how and how to extract and apply relevant metrics. Software Metrics Motivation. Quantitative tool to manage risk in software projects

E N D
Objectives • Understand why measurement is important • Understand the basic metrics approaches used in industry • Know how and how to extract and apply relevant metrics
Software Metrics Motivation • Quantitative tool to manage risk in software projects • Software metrics has always been driven by two key objectives: • software cost/resource estimation • software quality control and estimation • Measuring ‘size’ and measuring ‘defects’ is central
IBM Space Shuttle Software Metrics Program (1) Pre-release Defects per KLOC Post-release Software Release Number
IBM Space Shuttle Software Metrics Program (2) Predicted total error rate trend (errors per KLOC) 14 12 10 8 95% high 6 Actual expected 4 2 95% low 0 1 3 5 7 8A 8C 8F Onboard flight software releases
IBM Space Shuttle Software Metrics Program (3) Onboard flight software failures occurring per base system Basic operational increment
A Brief History of Software Metrics • First book (Gilb 1976) but LOC-based measures since 1960’s • LOC used as surrogate for different notions of software size • Drawbacks of LOC as size measure led to complexity metrics and function point metrics • Further metrics for design level, and for different language paradigms
The Enduring LOC Measure • LOC: Number of Lines Of Code • The simplest and most widely used measure of program size. Easy to compute and automate • Used (as normalising measure) for • effort/cost estimation (Effort = f(LOC)) • quality assessment/estimation (defects/LOC)) • productivity assessment (LOC/effort) • Alternative (similar) measures • KLOC: Thousands of Lines Of Code • KDSI: Thousands of Delivered Source Instructions • NCLOC: Non-Comment Lines of Code • Number of Characters or Number of Bytes
with TEXT_IO; use TEXT_IO; procedure Main is --This program copies characters from an input --file to an output file. Termination occurs --either when all characters are copied or --when a NULL character is input Nullchar, Eof: exception ; Char: CHA RACTER; Input_file, Output_file, Console: FILE_TYPE; Begin loop Open (FILE => Input_file, MODE => IN_FILE, NAME => “CharsIn”); Open (FILE => Output_file, MODE =>OUT_FILE, NAME => “CharOut”); Get (Input_file, Char); if END_OF_FILE (Input_file) then raise Eof; elseif Char = ASCII.NUL then raise Nullchar; else Put(Output_file, Char); end if ; end loop ; exception when Eof => Put (Console, “no null characters”); when Nullchar => Put (Console, “null terminator”); end Main LOC metric: how many LOC here?
Problems with LOC type measures • No standard definition • Measures length of programs rather than size • Wrongly used as a surrogate for: • effort • complexity • functionality • Fails to take account of redundancy and reuse • Cannot be used comparatively for different types of programming languages • Only available at the end of the development life-cycle
The ‘defect density’ measure: an important health warning defect density = number of defects foundsystem size (KLOC) Defect density is used as a de-facto measure of software quality
Simple COCOMO Effort Prediction effort = a (size)b effort = person months size = KDSI (predicted) a,b constants depending on type of system: ‘organic’: a = 2.4 b = 1.05 ‘semi-detached’: a = 3.0 b = 1.12 ‘embedded’: a = 3.6 b = 1.2
COCOMO Development Time Prediction time = a (effort)b effort = person months time = development time (months) a,b constants depending on type of system: ‘organic’: a = 2.5 b = 0.32 ‘semi-detached’: a = 2.5 b = 0.35 ‘embedded’: a = 2.5 b = 0.38
Regression Based Cost Modelling log E (Effort) 10,000 Slope b 1000 100 log E = log a + b * log S E = a * S b 10 log a 1K 10K 100K 1000K 10000K log S(Size)
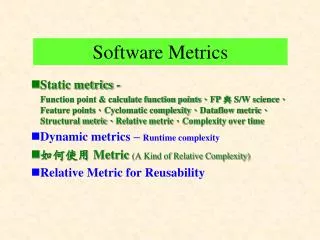
Software size attributes • length the physical size of the product • functionality measures the functions supplied by the product to the user • complexity • Problem complexity • Algorithmic complexity • Structural complexity • Cognitive complexity
The search for more discriminating metrics • Capture cognitive complexity • Capture structural complexity • Capture functionality (or functional complexity) • Language independent • Can be extracted at early life-cycle phases
Halstead’s Software Science Metrics A program P is a collection of tokens, classified as either operators or operands. n1 = number of unique operators n2 = number of unique operands N1 = total occurrences of operators N2 = total occurrences of operands Length of P is N = N1+N2Vocabulary of P is n = n1+n2 Theory: Estimate of N is N = n1 log n1 + n2 log n2 Theory: Effort required to generate P is n1 N2 N log n 2n2 (elementary mental discriminations) E = Theory: Time required to program P is T=E/18 seconds
McCabe’s Cyclomatic Complexity Metric v If G is the control flowgraph of program P and G has e edges (arcs) and n nodes v(P) = e-n+2 v(P) is the number of linearly independent paths in G here e = 16 n =13 v(P) = 5 More simply, if d is the number of decision nodes in G then v(P) = d+1 McCabe proposed: v(P)<10 for each module P
Flowgraph based measures • Many software measures are based on a flowgraph model of a program • Most such measures can be automatically computed once the flowgraph ‘decomposition’ is known • The notion of flowgraph decomposition provides a rigorous, generalised theory of structured programming • There are tools for computing flowgraph decomposition
Albrecht’s Function Points Count the number of: External inputs External outputs External inquiries External files Internal files giving each a ‘weighting factor’ The Unadjusted Function Count (UFC) is the sum of all these weighted scores To get the Adjusted Function Count (FP), multiply by a Technical Complexity Factor (TCF) FP = UFC x TCF
Spell-Checker Spec: The checker accepts as input a document file and anoptional personal dictionary file. The checker lists all words not containedin either of these files. The user can query the number of words processedand the number of spelling errors found at any stage during processing errors found enquiry # words processed message SpellingChecker words processes enquiry # errors message User User Document file Personal dictionary report on misspelt words words Dictionary A = # external inputs = 2, B =# external outputs = 3, C = # inquiries = 2, D = # external files = 2, E = # internal files = 1 Assuming average complexity in each case UFC = 4A + 5B + 4C +10D + 7E = 58 Function Points: Example
Function Points: Applications • Used extensively as a ‘size’ measure in preference to LOC • Examples: FP Person months effort Productivity Defects FP Quality Effort prediction E=f(FP)
Function Points and Program Size Language Source Statements per FP Assembler C Algol COBOL FORTRAN Pascal RPG PL/1 MODULA-2 PROLOG LISP BASIC 4 GL Database APL SMALLTALK Query languages Spreadsheet languages 320 150 106 106 106 91 80 80 71 64 64 64 40 32 21 16 6
Current State-of-the-Art • Company-wide measurement programmes • Benchmarking • SEI’s CMM process assessment • Metrics tools as standard in IDEs • Measurement theory as a unifying framework • International software measurement standards
ISO 9126 Software Product Evaluation Standard Quality characteristics and guidelines for their use Chosen characteristics are: • Functionality • Reliability • Usability • Efficiency • Maintainability • Portability
Goals Measures Data Facts/trends Decisions Actions Software Metrics:From Goals to Actions
Goal Question Metric (GQM) • There should be a clearly-defined need for every measurement. • From the goals, generate questions whose answers will tell you if the goals are met. • From the questions, suggest measurements that can help to answer the questions.
The Metrics Plan (for each goal) • WHY metrics can address the goal • WHAT metrics will be collected, how they will be defined, and how they will be analyzed • WHO will do the collecting, who will do the analyzing, and who will see the results • HOW it will be done - what tools, techniques and practices will be used to support metrics collection and analysis • WHEN in the process and how often the metrics will be collected and analyzed • WHERE the data will be stored
Summary • ‘Software metrics’ driven by two objectives: • cost/effort estimation • quality assessment and prediction • All common metrics traceable to above objectives • It is easy to extract code metrics, but they need to fit a pre-defined plan