Download
1 / 39
390 likes | 504 Views
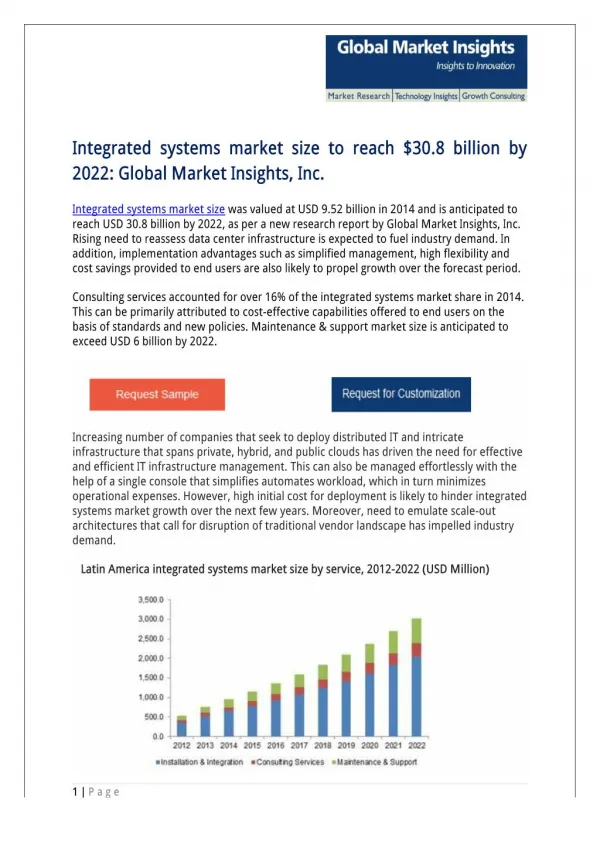
Integrated Systems + Principles Approach. Manufacturing Energy End-Use Breakdown. Source: California Energy Commission (2000). Energy Systems. Lighting Motor drive Fluid flow Compressed air Steam and hot water Process heating Process cooling Heating, ventilating and air conditioning

E N D
Manufacturing Energy End-Use Breakdown Source: California Energy Commission (2000)
Energy Systems • Lighting • Motor drive • Fluid flow • Compressed air • Steam and hot water • Process heating • Process cooling • Heating, ventilating and air conditioning • Cogeneration
Principles of Energy Efficiency • Inside Out Analysis • Understand Control Efficiency • Think Counter-flow • Avoid Mixing • Match Source Energy to End Use • Theoretical Minimum Energy Use • Whole-system, Whole-time Frame Analysis
Integrated Systems + Principles Approach • Integrated systems + principles approach (ISPA) = Systems approach + Principles of energy efficiency • ISPA is both effective and thorough.
Inside-out Amplifies Savings Reduce pipe friction: Savings = 1.00 kWh Pump 70% eff: Savings = 1.43 kWh Drive 95% eff: Savings = 1.50 kWh Motor 90% eff: Savings = 1.67 kWh T&D 91% eff: Savings = 1.83 kWh Powerplant 33% eff: Savings = 5.55 kWh
Inside-out Reduces First Costs • Original design • 95 hp in 14 pumps • Re-design: • Bigger pipes: Dp = c / d5 • (doubling d reduces Dp by 97%) • Layout pipes then equipment • shorter runs, fewer turns, valves, etc… • 7 hp in 2 pumps
Inside-Out: Example • Aluminum die-cast machines • Use 100 psig air to force aluminum to mold • Need 40 psig air • Purchase low-pressure blower and avoid compressor upgrade • Estimated savings = $11,000 /yr • Estimated implementation cost = -$47,000
Inside-Out Summary Inside-Out • Big savings at low first costs • Focuses on core products and processes • Internalizes and sustains efficiency efforts Outside-In • Small savings at high first costs • Focuses on support equip • Fosters extraneous and periodic efficiency efforts
2. Understand Control Efficiency • Systems designed for peak load, but operate at part load • System efficiency generally changes at part load • Recognize and modify systems with poor part- load (control) efficiency
Air Compressor Control FP = FP0 + FC (1 – FP0)
3. Think Counter-flow T Q Parallel Flow x T Q Counter Flow x
Counter-flow Stack Furnace Pre-heats Charge Reverb Furnace Efficiency = 25% Stack Furnace Efficiency = 44% (Eppich and Nuranjo, 2007)
Counter-Flow Heat Treat Stack Burners Extending hood saves $40,000 /yr Current Design Recommended Design
Counter-Flow Heat Recovery Vinegar Pasteurization and Cooling
Counter-Flow Heat Recovery Counter-flow heat exchanger saves $17,000 /yr
Counter-flow Glass Heating Counter flow increases convection heat transfer by 83% Contact length = 2 x (5 + 4 + 3 + 2 + 1) = 30 feet Contact length = (10 + 9 + 8 + 7 + 6 + 5 + 4 + 3 + 2 + 1) = 55 feet
Counter-flow Tile Kiln Tile Exit Tile Entrance Counter-flow tile kiln saves 33%
Counter-Flow Cooling Counter flow enables 50 F to 70 F water saves 10x
4. Avoid Mixing • Availability analysis… Useful work destroyed with mixing • Examples • CAV/VAV air handlers • Separate hot and cold wells • Material reuse/recycling
HVAC Applications Cooling Energy Use Heating Energy Use
Cooling Applications Separate tank into hot and cold sides
Pumping Air Pumps Use 7x More Electricity
Lighting Eyes See Best in Sunlight
6. Theoretical Minimum Energy Use • Always ask “how much energy is really required ?” • Not much. • 2.5% of primary energy used to provide energy services Ayers (1989)
TME of Industrial Processes Choate and Green (2003), Fruehan, et al. (2000), and Worrell, et al. (2000)
Parts on UV Curing Oven Slowed belt, shut of excess lamps, saved 50%
7. Whole-System Whole-Time Frame Design • Design heuristic derived from natural evolution • Nothing evolves in a vacuum, only as part of a system • No optimum tree, fan, … • Evolutionary perspective: ‘optimum’ synonymous with ‘perfectly integrated’ • Optimize whole system, not components • Design for whole time frame, next generation
Whole System Energy Engineering“Optimum Pipe Diameter” • Dopt = 200 mm when Tot Cost = NPV(Energy)+Pipe • Dopt = 250 mm when Cost= NPV(Energy)+Pipe+Pump • Energy250 = Energy200 / 2
Whole-System Whole-Time Frame Accounting“Efficiency Gap” • “Numerous studies conclude 20% to 40% energy savings could be implemented cost effectively, but aren’t…..” • Discrepancy between economic and actual savings potential called “efficiency gap”. • Puzzled economists for decades: “I can’t believe they leave that much change lying on the table.”
Whole System Accounting:“Don’t Separate Capital and Operational Budgets” • Separate capital and operational budgets • Organizational sub-systems constrain optimums • Enlarge budgeting to consider entire company
Whole Time Frame Accounting:“Don’t Eat Your Seed Corn” • SP = 2 years (10 year life) is ROI = 49% • SP = 5 years (10 year life) is ROI = 15% • SP = 10 years (20 year life) is ROI = 8%