Download
1 / 49
490 likes | 511 Views
Chapter 4: The Human Population and the Environment -. Hint: Look at the Notes when you are not in slide show review for important questions discussed in class!. Basic Concepts of Population Dynamics. A population is a group of individuals of the same species living in the same area.

E N D
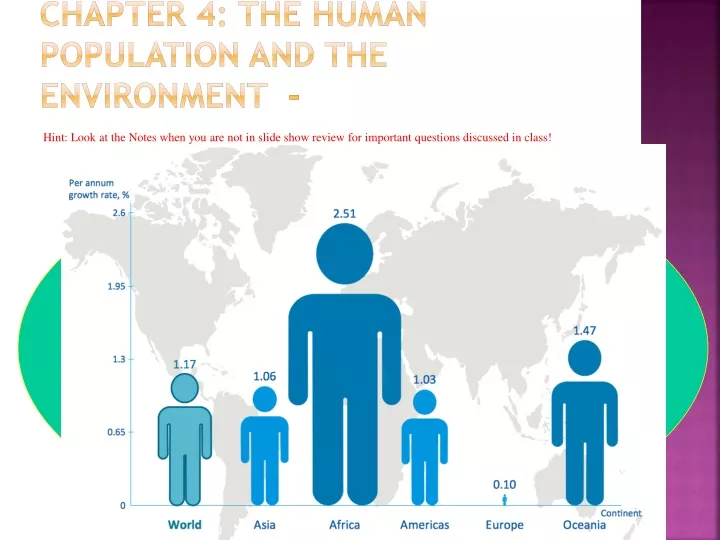
Chapter 4: The Human Population and the Environment - Hint: Look at the Notes when you are not in slide show review for important questions discussed in class!
Basic Concepts of Population Dynamics • A population is a group of individuals of the same species living in the same area. • A species is all individuals that are capable of interbreeding. • .
Basic Concepts of Population Dynamics • Five key properties of any population • Abundance • Birth rates • Death rates • Growth rates • Age structure
Basic Concepts of Population Dynamics • Demographics is the statistical study of human populations. • The general study of population changes is called Population Dynamics. • How rapidly a pop changes depends on GR Growth rate = (birth rate – death rate)
Age Structure • The proportion of the population at each age. • Implication for current and future social and economic conditions - What if no one is having babies? What if 70% of the population is under age 30? (true in several countries) • Impact on the environment - do older people have as large an impact as young people?
Age Structure • Four general types • Pyramid- population w/ many young and high death rate (short average lifetime) • Inverted pyramid- top heavy (Japan?) • Column- birth rate and death rate are low and a high % of pop is elderly • Column w/ a bulge- event in the past caused a high birth or death rate for some age group
Age Structure Pyramid example Column with bulge Column
Kinds of Population Growth • Exponential Growth • A pop increasing by a constant percentage per unit time. • Human pop growth peaked at 2.1% • 1965-1970 • Human pop growth is now appr. 1.2%
History of Human Population Growth • 1. Early period of hunter and gathers - the total population was < a few million (>10,000 yrs ago) • 2. Rise of agriculture- allowed for increase in population density and increased human population • 3. Industrial revolution - improvements in health and food supply led to rapid inc in population • 4. Today - the rate of growth is slow in industrialized nations but high in less developed nations
Present Human Population Rates of Growth • Current world population >7 billion • With annual growth rate of 1.2% • At this rate 84 million people added to Earth in 1 year • Correlation between poverty and population growth • Positive feedback – Poverty Lacks education, healthcare, and family planning thus • = increase in birth rates and family sizes
Present Human Population Rates of Growth Current US growth rate 0.6%
Projecting Future Population Growth • Doubling time (time required for a pop to double in size) is very sensitive to growth rate (g.r) • It changes quickly as g.r. changes • US w/ a g.r. of 0.6% has a doubling time of 117 yrs • Nicaragua w/ a g.r. of 2.7%, d.t. = 26 yrs • Northern Europe w/ a g.r. of 0.2%, d.t. = 350 yrs
Logistic Growth Curve • S shaped curve • Increase exponentially only temporarily • Then growth rate would decline • Reach an upper pop limit @ logistic carrying capacity (g.r. = 0)
Logistic Growth Curves • Population evens out as it reaches carrying capacity
Logistic Growth Curve • Little evidence that animal populations actually follow this growth curve • Involves assumptions • Constant environment • Constant changing carrying capacity • Homogeneous population • Unlikely if death rate continue to decrease • More births = increase in population
Demographic Transition • Three stage pattern of change in birth rates and death rates • Occurred during the process of industrial and economic development of Western nations • Leads to decline in pop growth rate
Demographic Transition • Stage 1 • Nonindustrial country • Birth rate and death rate high, growth rate low • Stage 2 • Period of high growth rate • W/ industrialization death rate declines but birth rate stays high
Demographic Transition • Stage 3 • Birth rate drops toward death rate • Growth rate decreases • Will take place if parents come to believe that having a small family is to their benefit.
Population and Technology • Impact that all humans pose on the environment is a result of two factors • Number of people • Impact of each person on the environment • Total impact (Ti) of the human population on environment = average individual impact x total # of individuals or … • Ti = P x I
Population and Technology • Modern technology increases the use of resources and enables us to effect the environment in new ways. • E.g. CFCs, automobiles • Therefore we see that although technology lowers birth rates and decreases death rates, it increases the the average environmental impact per person
Human Carrying Capacity • How many people can live on Earth at the same time? • Answer depends on the quality of life people desire and are willing to accept. • Estimates vary based on assumptions made. • “distribution-problem” - largely it’s a matter of where people are and how many there are in that area
Potential Effects of Medical Advances on Demographic Transition • Second decline in death rate • Leads to Stage IV • A second stable state would arise if birth rate then falls….. Leading to • Stage V • Decision that might need to be made • Stop research on diseases of old age? • Reduce birth rate? • Wait for Malthus’ projections to come true? • Disallow “certain” people from having babies?
Quality of life • If people of the world were to live at the same level as those in US • High resource use • Carrying capacity would be low • If people of the world were to live at the same level as those in Bangladesh • Poverty and heavy drain on biodiversity • Carrying capacity would be much higher
Human Death Rates • Acute or epidemic diseases - appear rapidly and affect a large numbers before declining. • Chronic disease- always present in a pop, typically occurring in small as result of long environmental exposure. (Smoking: lung cancer) • Emerging diseases could effect both industrial and less developed nations because of long range rapid transportation • SARS • West Nile Virus • Epidemic flu (or Pandemic - H1N1 - Swine flu)
Longevity and Its Effect on Population Growth • Maximum lifetime- maximum possible age to which an individual of a species can live. • Life expectancy- the average # of years an individual can expect to live. • Higher in developed nation - due to availability of sanitation and technology • Japan highest, 82 years • Developing nations - Botswana, Lesotho and Swaziland lowest, 35 years; notice the dramatic differential!
Limiting Factors • Human populations will eventually be limited by some factor or combo of factors • Short-term - affect pop during the year in which they become limiting • Intermediate-term - effects are apparent after 1 yr but before 10yrs. • Long-term – effects are not apparent for 10yrs
How Can We Achieve Zero Population Growth? • Simplest and one of the most effective is to delay the age of 1st childbearing by women.
How Can We Achieve Zero Population Growth? • Birth Control • Breast-feeding can delay resumption of ovulation • Family planning methods from abstinence to induction of sterility w/ natural agents • ONLY Zero population growth will allow for a “sustainable” future.
National Programs to Reduce Birth Rates • The choice of population control methods is an issue that involves social, moral and religious beliefs • Wide range of approaches • Information • Accesses to birth control • Rewards and penalties - Canadian system example • Limit household size – China’s one child policy
What will our future look like? New York City Billings, Montana
The United Nations has a program focused on human population growth. Explore the website below to obtain more information on what experts believe is the state of the human population. • a) It is commonly assumed that those countries with the most cropland will have the greatest amount of food per capita and the fewest people who are undernourished. Is this assumption accurate? [Hint: look at the charts and graphs available on the website.] Southeastern and South-central Asia and Western Europe have the lowest amount of cropland per capita. What regions have the highest and lowest percentage of population who are undernourished? If the regions with the highest starvation rate are not the regions with the lowest amount of cropland per capita, what else could be causing people to be undernourished? If we are going to be able to reduce the number of people who are malnourished and/or starving, we need facts, not opinions. Explore the UN website for information that will help you arrive at a conclusion. http://www.unfpa.org/swp/swpmain.htm
The current human population represents something unprecedented in the history of the world. Never before has one species had such a great impact on the environment in such a short time and continued to increase so rapidly. These qualities make human population the underlying environmental issue. After reading this chapter, you should understand: That ultimately, there can be no long-term solutions to environmental problems unless the human population stops increasing. That two major questions about the human population involve what controls its rate of growth and how many people the earth can sustain. That the rapid increase in the human population has occurred with little or no change in the maximum lifetime of an individual. That modern medical practices, as well as improvements in sanitation, control of disease-spreading organisms, and supplies of human necessities, have decreased death rates and accelerated the net rate of human population growth. That even under the best imaginable scenario that experts in human populations have put forward, the human population will double before it stops increasing. That countries with a high standard of living have moved more quickly to a lower birth rate than have countries with a low standard of living. That although we cannot predict with absolute certainty what the future human carrying capacity of Earth will be, understanding of human population can help us make useful forecasts.