Download
1 / 91
910 likes | 1.03k Views
South Africa: - A Socio-Economic Perspective. Presented by: Dawie Roodt IMFO Conference 12 September 2007. Through the Eyes of the World. Source: The Economist January 20-26, 2007 Full page advertisements (Est. Cost: £87,500). The Opposition p. 15. The Home Team p. 17. Value for Money?.

E N D
South Africa:- A Socio-Economic Perspective Presented by: Dawie Roodt IMFO Conference 12 September 2007
Through the Eyes of the World Source: The Economist January 20-26, 2007 Full page advertisements (Est. Cost: £87,500)
Value for Money? But why say it?
GDP at Market Prices Source: StatsSA and own calculations
GDP Source: StatsSA and own calculations
Relative size to GDP Source: StatsSA and own calculations
Background Gold
Background Source: SARB and own calculations
Inflation 14.6% Inflation bracket 10.0% 5.2% Source: StatsSA and own calculations
Credit Extension Source: SARB and own calculations
Household debt to disposable income 59.4% 56.9% 50.2% 44.5% Source: SARB and own calculations
Savings to disposable income of households 9.2% 5.4% 2.6% 0.5% Source: SARB and own calculations
Balance of Payments Source: SARS and own calculations
Housing Trends Source: Absa House Price Index, StatsSA and own calculation
Average Wage Settlements and the Inflation Rate, 1985-2004 Source: South Africa Survey 2004/2005; Andrew Levy Employment Publications
Mandays Lost as Result of Strikes and Lockouts, 1980-2004 Two large strikes in mining and transport sectors Source: South Africa Survey 2004/2005; Andrew Levy Employment Publications
Strikes by Sector,% of Total Manday Lost (2004) Source: South Africa Survey 2004/2005; Andrew Levy Employment Publications
Economic Impact of the 2010 FIFA World Cup • Direct expenditure of R30.4bn • R15.6bn to be spent by expected 350,000 tourists • Contribute R51.0 billion to the GDP of South Africa (2006-2010) • Generate the equivalent of 159 000 annual jobs • Additional R7,2 billion will be paid to Government in taxes. Source: Gauteng Tourism Authority and Grant Thornton (Financial mail)
Problems: Debt Levels Tax levels Unemployment Crime AIDS Skills State inefficiency Summary Positives: • Strong GDP growth • State debt at more sustainable level • More stable interest rate • Capital expenditure plans
Percentage of World GDP ‘06 Source: World Bank
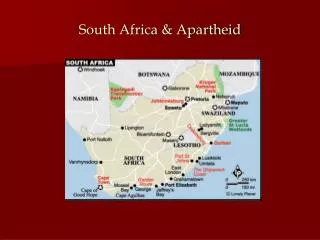
4% of African area 23% of African GDP 22% of African Exports 20% of African Imports
GDP Source: UN
Countries Compared to Provinces Source: UN
Africa Average Annual GDP Growth, 1996 - 2005 Equatorial Guinea Mozambique Angola Congo Average: 4.2 Median: 3.6 South Africa Zimbabwe Source: World Bank, Africa Development Indicators, 2006 Oil-exporters
Africa’s Divergent Growth Paths Eq. Guinea (20.9) Angola (7.9) Nigeria (4.0) Mozambique (8.4) Botswana (5.7) Mauritius (4.9) Ave: 5.5 Ave: 7.4 Namibia (4.0) Malawi (3.2) South Africa (3.1) Kenya (2.8) DRC (0.0) Zimbabwe (-2.4) Ave: 3.4 Ave: 1.3 Source: World Bank, Africa Development Indicators, 2006
Close-up on South Africa Source: Unesco and World Bank Development Indicators
Social Services Expenditure as % of Total Expenditure Source: Various Budgets and own calculation
Human Poverty Index (HPI): Developing Countries (HPI-1),2004 Mali South Africa 2004 South Africa(1998) Average: 30 Cuba Median: 27 Source: Human Development Report, 2006 (undp.org)