Download
1 / 32
320 likes | 440 Views
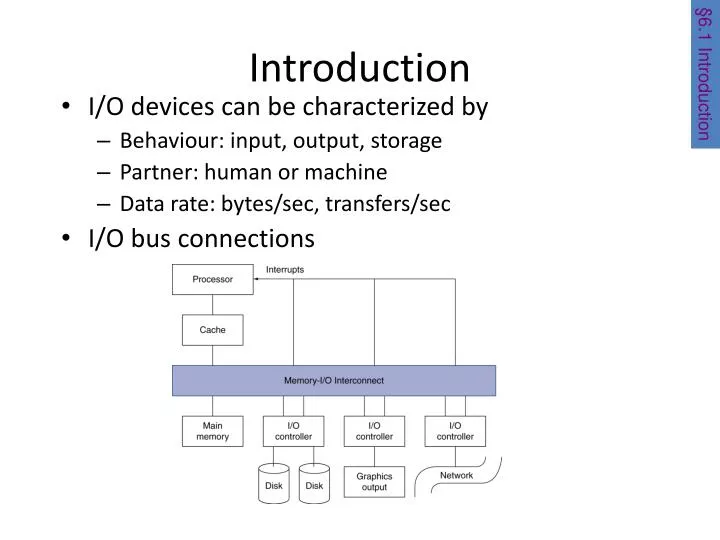
Introduction. §6.1 Introduction. I/O devices can be characterized by Behaviour: input, output, storage Partner: human or machine Data rate: bytes/sec, transfers/sec I/O bus connections. I/O System Characteristics. Dependability is important Particularly for storage devices

E N D
Introduction §6.1 Introduction • I/O devices can be characterized by • Behaviour: input, output, storage • Partner: human or machine • Data rate: bytes/sec, transfers/sec • I/O bus connections
I/O System Characteristics • Dependability is important • Particularly for storage devices • Performance measures • Latency (response time) • Throughput (bandwidth) • Desktops & embedded systems • Mainly interested in response time & diversity of devices • Servers • Mainly interested in throughput & expandability of devices
Dependability Service accomplishment Service deliveredas specified • Fault: failure of a component • May or may not lead to system failure §6.2 Dependability, Reliability, and Availability Restoration Failure Service interruption Deviation fromspecified service
Dependability Measures • Reliability: mean time to failure (MTTF) • Service interruption: mean time to repair (MTTR) • Mean time between failures • MTBF = MTTF + MTTR • Availability = MTTF / (MTTF + MTTR) • Improving Availability • Increase MTTF: fault avoidance, fault tolerance, fault forecasting • Reduce MTTR: improved tools and processes for diagnosis and repair
Disk Storage §6.3 Disk Storage • Nonvolatile, rotating magnetic storage
Disk Sectors and Access • Each sector records • Sector ID • Data (512 bytes, 4096 bytes proposed) • Error correcting code (ECC) • Used to hide defects and recording errors • Synchronization fields and gaps • Access to a sector involves • Queuing delay if other accesses are pending • Seek: move the heads • Rotational latency • Data transfer • Controller overhead
Disk Access Example • Given • 512B sector, 15,000rpm, 4ms average seek time, 100MB/s transfer rate, 0.2ms controller overhead, idle disk • Average read time • 4ms seek time+ ½ / (15,000/60) = 2ms rotational latency+ 512 / 100MB/s = 0.005ms transfer time+ 0.2ms controller delay= 6.2ms • If actual average seek time is 1ms • Average read time = 3.2ms
Disk Performance Issues • Manufacturers quote average seek time • Based on all possible seeks • Locality and OS scheduling lead to smaller actual average seek times • Smart disk controller allocate physical sectors on disk • Present logical sector interface to host • Disk drives include caches • Prefetch sectors in anticipation of access - locality • Avoid seek and rotational delay
Flash Storage §6.4 Flash Storage • Nonvolatile semiconductor storage • 100× – 1000× faster than disk • Smaller, lower power, more robust • But more $/GB (between disk and DRAM)
Flash Types • NOR flash: bit cell like a NOR gate • Random read/write access • Used for instruction memory in embedded systems • NAND flash: bit cell like a NAND gate • Denser (bits/area), but block-at-a-time access • Cheaper per GB • Used for USB keys, media storage, … • Flash bits wears out after 1000’s of accesses • Not suitable for direct RAM or disk replacement • Wear leveling: remap data to less used blocks
Interconnecting Components • Need interconnections between • CPU, memory, I/O controllers • Bus: shared communication channel • Parallel set of wires for data and synchronization of data transfer • Can become a bottleneck • Performance limited by physical factors • Wire length, number of connections • More recent alternative: high-speed serial connections with switches • Like networks §6.5 Connecting Processors, Memory, and I/O Devices
Bus Types • Processor-Memory buses • Short, high speed • Design is matched to memory organization • I/O buses • Longer, allowing multiple connections • Specified by standards for interoperability • Connect to processor-memory bus through a bridge
Bus Signals and Synchronization • Data lines • Carry address and data • Multiplexed or separate • Control lines • Indicate data type, synchronize transactions • Synchronous • Uses a bus clock • Asynchronous • Uses request/acknowledge control lines for handshaking
I/O Management §6.6 Interfacing I/O Devices … • I/O is mediated by the OS • Multiple programs share I/O resources • Need protection and scheduling • I/O causes asynchronous interrupts • Same mechanism as exceptions • I/O programming is fiddly • OS provides abstractions to programs
I/O Commands • I/O devices are managed by I/O controller hardware • Transfers data to/from device • Synchronizes operations with software • Command registers • Cause device to do something • Status registers • Indicate what the device is doing and occurrence of errors • Data registers • Write: transfer data to a device • Read: transfer data from a device
I/O Register Mapping • Memory mapped I/O • Registers are addressed in same space as memory • Address decoder distinguishes between them • OS uses address translation mechanism to make them only accessible to kernel • I/O instructions • Separate instructions to access I/O registers • Can only be executed in kernel mode • Example: x86
Polling • Periodically check I/O status register • If device ready, do operation • If error, take action • Common in small or low-performance real-time embedded systems • Predictable timing • Low hardware cost • In other systems, wastes CPU time
Interrupts • When a device is ready or error occurs • Controller interrupts CPU • Interrupt is like an exception • But not synchronized to instruction execution • Can invoke handler between instructions • Cause information often identifies the interrupting device • Priority interrupts • Devices needing more urgent attention get higher priority • Can interrupt handler for a lower priority interrupt
I/O Data Transfer • Polling and interrupt-driven I/O • CPU transfers data between memory and I/O data registers • Time consuming for high-speed devices • Direct memory access (DMA) • OS provides starting address in memory • I/O controller transfers to/from memory autonomously • Controller interrupts on completion or error
DMA/Cache Interaction • If DMA writes to a memory block that is cached • Cached copy becomes stale • If write-back cache has dirty block, and DMA reads memory block • Reads stale data • Need to ensure cache coherence • Flush blocks from cache if they will be used for DMA • Or use non-cacheable memory locations for I/O
DMA/VM Interaction • OS uses virtual addresses for memory • DMA blocks may not be contiguous in physical memory • Should DMA use virtual addresses? • Would require controller to do translation • If DMA uses physical addresses • May need to break transfers into page-sized chunks • Or chain multiple transfers • Or allocate contiguous physical pages for DMA
Measuring I/O Performance • I/O performance depends on • Hardware: CPU, memory, controllers, buses • Software: operating system, database management system, application • Workload: request rates and patterns • I/O system design can trade-off between response time and throughput §6.7 I/O Performance Measures: …
Transaction Processing Benchmarks • Transactions • Small data accesses to a DBMS • Interested in I/O rate, not data rate • Measure throughput • Subject to response time limits and failure handling • Overall cost per transaction • Transaction Processing Council (TPC) benchmarks (www.tcp.org) • TPC-APP: B2B application server and web services • TCP-C: on-line order entry environment • TCP-E: on-line transaction processing for brokerage firm • TPC-H: decision support — business oriented ad-hoc queries
File System & Web Benchmarks • SPEC System File System (SFS) • Synthetic workload for NFS server, based on monitoring real systems • Results • Throughput (operations/sec) • Response time (average ms/operation) • SPEC Web Server benchmark • Measures simultaneous user sessions, subject to required throughput/session • Three workloads: Banking, Ecommerce, and Support
I/O vs. CPU Performance §6.9 Parallelism and I/O: RAID • Amdahl’s Law • Don’t neglect I/O performance as parallelism increases compute performance • Example • Benchmark takes 90s CPU time, 10s I/O time • Double the number of CPUs/2 years • I/O unchanged
RAID • Redundant Array of Inexpensive (Independent) Disks • Use multiple smaller disks (c.f. one large disk) • Parallelism improves performance • Plus extra disk(s) for redundant data storage • Provides fault tolerant storage system • Especially if failed disks can be “hot swapped” • RAID 0 • No redundancy (“AID”?) • Just stripe data over multiple disks • But it does improve performance
RAID 1 & 2 • RAID 1: Mirroring • N + N disks, replicate data • Write data to both data disk and mirror disk • On disk failure, read from mirror • RAID 2: Error correcting code (ECC) • N + E disks (e.g., 10 + 4) • Split data at bit level across N disks • Generate E-bit ECC • Too complex, not used in practice
RAID 5: Distributed Parity • N + 1 disks • Like RAID 4, but parity blocks distributed across disks • Avoids parity disk being a bottleneck • Widely used
RAID 6: P + Q Redundancy • N + 2 disks • Like RAID 5, but two lots of parity • Greater fault tolerance through more redundancy • Multiple RAID • More advanced systems give similar fault tolerance with better performance
RAID Summary • RAID can improve performance and availability • High availability requires hot swapping • Assumes independent disk failures • Too bad if the building burns down! • See “Hard Disk Performance, Quality and Reliability” • http://www.pcguide.com/ref/hdd/perf/index.htm
Fallacies • Disk failure rates are as specified • Studies of failure rates in the field • Schroeder and Gibson: 2% to 4% vs. 0.6% to 0.8% • Pinheiro, et al.: 1.7% (first year) to 8.6% (third year) vs. 1.5% • Why? • A 1GB/s interconnect transfers 1GB in one sec • But what’s a GB? • For bandwidth, use 1GB = 109 B • For storage, use 1GB = 230 B = 1.075×10⁹ B • So 1GB/sec is 0.93GB in one second • About 7% error
Pitfall: Backing Up to Tape • Magnetic tape used to have advantages • Removable, high capacity • Advantages eroded by disk technology developments • Makes better sense to replicate data • E.g, RAID, remote mirroring