Download
1 / 5
50 likes | 178 Views
MultiLoop III - Tutorial 2. Renormalizing Profile Data (continued from Tutorial 1). Existing normalization is continuous. Normalized by the absolute value of the rx. component of the primary field. When point normalizing, the location & direction cosine are set here.

E N D
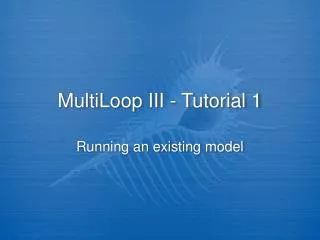
MultiLoop III - Tutorial 2 Renormalizing Profile Data (continued from Tutorial 1)
Existing normalization is continuous Normalized by the absolute value of the rx. component of the primary field When point normalizing, the location & direction cosine are set here Select Presentation from the system menu Normalized ratio will be multiplied by 100 to convert to percent Normalization can be customized by changing the numerator & denominator No waveform attributes will be used in the normalization No transforms are selected Step 1: Normalization Dialogue The Set Default Presentation dialogue displays the current presentation state • Complete Tutorial 1. • Select Presentation from the System menu • The Set Default Presentation dialogue appears • The dialogue displays the current presentation settings • The output file is described. • Go.
Select “Not Normalized” Select “OK” Step 2: Change Normalization • Select “Not Normalized” • Click OK • GO… Whenever the normalization changes, this message appears. Click yes to change the y-axis plotting scale to fit the new normalization
Step 3: Write Data Select the file • From the Exports menu, select Write Data • Select the filename to write in the File Dialogue • Do not transform the data, this will be explained later • Go…. Select “Write Data” in the “Exports” menu If the file name exists, you will be allowed to cancel, click “Replace” Answer “Yes” to write the renormalized data Click save
Step 4: Data file formats Description of response and version Survey & Dataset name, time of creation Rx Dipole Components are written after the primary field data License & solver info System and presentation information Normalization and primary field data are written after the channels Column labels; channel names combine gate and rx names Gate description Station Number X,Y,Z Coordinates Data