Download
1 / 16
160 likes | 328 Views
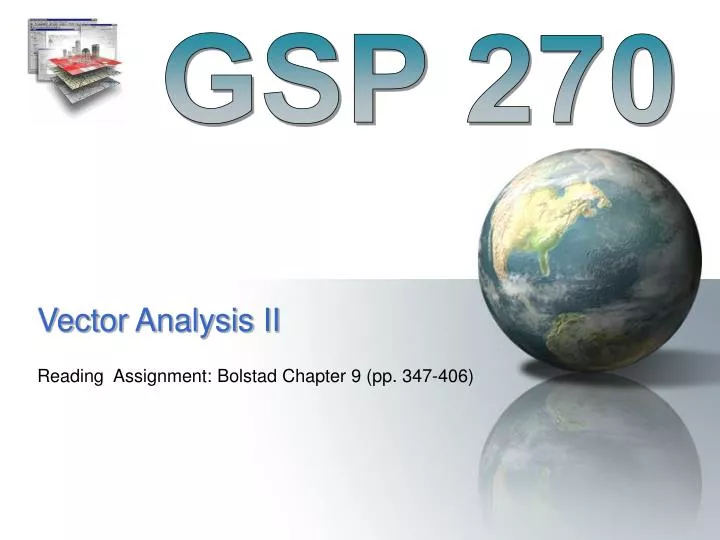
GSP 270. Vector Analysis II. Reading Assignment: Bolstad Chapter 9 (pp. 347-406). “Standard” (IBM) Flow Charts. - Start and End. Start. ?. - Decision. - Process (something that changes the data). Process. - Spatial or tabular data. Data Set. - Shows the “Flow”.

E N D
GSP 270 Vector Analysis II Reading Assignment: Bolstad Chapter 9 (pp. 347-406)
“Standard” (IBM) Flow Charts - Start and End Start ? - Decision - Process (something that changes the data) Process - Spatial or tabular data Data Set - Shows the “Flow”
Flow Chart to Check SRS Start Is the Coordinate system defined? Yes No Is the coordinate system correct? Find out what the coordinate system is Yes No “Define” the coordinate system Found it? Yes No Continue Can’t use the data
Projecting Data Start Is the data in the desired SRS? Yes No Project to desired SRS to “Working” folder Copy the data to “Working” folder Stop
Model Builder Flow Symbols There is no “start” and “end” is really “pause” ? - Decision Process - Process (something that changes the data) Data - Spatial or tabular data - Shows the “Flow” Note: The colors default to black and white and can be changed by the user
ArcMap Model Builder Symbols Rivers Rivers Buffer Buffer Non Harvestable Trails Buffer Trails Buffer Union Power Line Buffer Power lines Erase Buffer High Slope Slope High Slope Total Harvestable Acres Convert to Vector Reclass
The Mighty and Dreaded Toolbox! • Take some time and get to know it
Finding Tools • Need to know the location or the name of the tool • Union in a single layer -> “Dissolve” • To find the names: • Browse the tool box • Search the web: “ArcMap Union” • Once you find the tool you need: • Write down it’s name and/or location in the toolbox
Generalization • ArcToolbox -> Data Management Tools -> Generalization -> …
Generalization (100 meters) Original Generalized to 100 meters
Generalization (1000 meters) Original Generalized to 1000 meters
Vector Processing • Perform math on attributes using “Field Calculator” • Query attributes to select desired features • Right click on layer -> Selection -> Create Layer from Selected Features • New Shapefile and Layer • Perform spatial analysis • Repeat
Problem 1 • Find the area of potential overspray from a farm into a conservation easement if: • You have a shapefile for the farm and the conservation easement • The overspray can be up to 50 meters
Problem 2 • Find the harvestable area of a forest given: • Stream shapefile • Forest shapefile • You cannot harvest within 15 meters of a stream
Problem 3 • What is the total length of roads that are within 20 meters of a stream given: • Stream shapefile • Road shapefile