Download
1 / 40
400 likes | 560 Views
Africa’s Demographic Challenges Amidst the Global Ecological Crisis. Emerging Africa 2012 Old Friends, New Partnerships and Perspectives for the 21st Century Influences from Outside of the Continent: Socio-Cultural Issues, Media and Law June 1 5 201 2, Pécs

E N D
Africa’s Demographic ChallengesAmidst the Global Ecological Crisis Emerging Africa 2012 Old Friends, New Partnerships and Perspectives for the 21st Century Influences from Outside of the Continent: Socio-Cultural Issues, Media and Law June 15 2012, Pécs Gyula Simonyi, president, BOCS Foundation, Hungary
The impact of ecological limits on population growth „Demographers are predicting that world population will climb to 10 billion this century. But with increasing pressure on water and food supplies will this projected population boom turn into a bust?” Robert Engelman (World Watch Institute) Yale Environment 360, Guardian Environment Network guardian.co.uk, Friday 14 October 2011
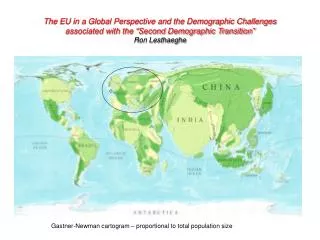
This graph shows60 countries,altogether6 027 million people(87% of the world's population):the biggest and/orthe most quickly growing populations(plus some other interesting countries).
In the grey, red, orange and yellow columns:5 073 million people (84 %)live in countries whichoverload their territory:313 million > 4x3 372 million 2-4 times1 160 million 1.5-2 times227 million < 1.5xOnly 954 million people(16 %) live in countries whichhave not overloaded their territory yet (white and green columns).(Data: Global Footprint Network)
Vertical axis shows the trend of the population growth (yearly, %).In the countries above of thewavy line the populationstarted decreasing. The country is more under the wavy line the population growth is quicker. From the 6 027 million people only 532 million (8,8%) live in countries where the population growth has stopped. From the 6 027 million people 5 495 million (91,2%) live in countries where the population is still growing.
Possibility for harmony (6,5 % only): the population growth hasstopped, but the countries still overload their territory. Future winners (2,3 % only): not overloaded, population growth hasstopped. Decreasing richness / trap of poverty (13,7 % only): the territory is notoverloaded yet, butthepopulation is still growing. Worse and worse (77,5 %): these countries overload their territory and thepopulation is still growing.
Footprint per capita: The amount which is used by thegiven country with its present lifestylefrom the biocapacity of the Earthdivided by the number of inhabitants. Biocapacity per capita: The biocapacity of the countrydivided by the number of inhabitants.
Countries in Sub-Saharan Africa In the countries with populationexplosion the biocapacity per capitadecreases strongly (green line).When it sinks low, the poverty traps them.When the green line goes under thered line, the territory is overloadedand it is losing biocapacity.
Overloaded, 2 % annual population growth Nigeria: biocapacity/capita is halved in 4 decades (1965-2005), recently the half of the Hungarian eco-footprint/capita level makes overload already. Tanzania: biocapacity/capita is only one third of what was in 1965. In spite of poverty it also started to overload its territory.
Overloaded, 2,5 – 3 % annual pop. growth Kenya, Rwanda, Togo, Malawi, Benin: biocapacity/capita is 2-4 times less than in 1965. Trap of poverty: even with one third of the Hungarian eco-footprint/capita they overload their territory. Population growth in some countries even speeding up.
Overloaded, 3 – 3,5 % annual pop. growth Ethiopia, Uganda, Burundi: Even poverty overburden the territory. Niger: a bit better situation, biocapacity is on the world avarage level.
Not overloaded yet, but quick population growth Mozambique, Eritreia, Sudan: biocapacity is on the world avarage level, and they are not overloaded yet. Sierra Leone: trap of poverty.
Not overloaded,but quick population growth Senegal: trap of poverty. Congo DR, Mali: still good possibility, biocapacity on the world avarage level.
Not overloaded, but quick population growth Guinea, Madagascar, Zambia: Still good possibility, biocapacity is more than the world avarage level.
Most countries move this way in the graph. But when the population growth decreases slowly only, the ecological overload increases hopelessly and the Earth is less and less livable.
Ecological crisis is a strong driving force to ensure human right of family planning,sexual and reproductive rights of women,sexual education of youth. The nature will unavoidably and cruedly force a much smaller human population and ecological footprint. Would we prevent this with open minded, voluntarily, humanitary decreasing? Would we take a further step in the human evolution: humanization of reproductive ability?
The graph of eastern Asia shows the 1+4 stages of the demographic change: 0. Historical stage (beyond the graph): low age, high reproduction and child mortality rate, low population growth.
In the human evolution the humanization of reproductive ability has crucial importance, preventing the hundred millions of accidental conception annually. This means a demographic transition: the population explosion stops and the population will strongly decrease, so that people can live quality life without overloading the Earth.Nowadays the population grows with 80.000.000 each year, the Earth is 1.5 times overloaded already, our civilization started to collapse. Today more people are suffering of hunger than the total number of population was 200 years ago. The fatal riders of Apocalypse, the Famine, the Plague and the Violence are harvesting more and more and say gladly: Why would they use contraception if we are here?
Countries with the biggest population in the World (China, USA, India).Their population is still growing and they overload their territory 2-4 times!
These 3 countries are in the left-bottom part of the graph. The population in Iraq is still growing fast even the territory of the country is already overloaded.
Top-right countries The only country in the ‘happy’ part is Russia, it’s not overloading its territory and the population stopped growing. The population growth stopped in the countries on the other side of the axis as well, but they overload their territory.
Wealthy countries (on the right) have a lot biocapacity and they haven’t overloaded their territory yet.The population in these countries grows.
Green arrow:Population growth rate and the overloading decreased during the last 10 years. Yellowarrow: Populationgrowthratedecreasedduringthelast 10 years, buttheoverloadingincreased.
Light red arrow:Overloading decreased during the last 10 years, but population growth rate increased. Red arrow: Populationgrowthrate and theoverloadingincreasedduringthelast 10 years.
Where these rectangles are small there is not enough natural resource for the wealthy life! In the small graphs the green, brown and blue rectangles show the current biocapacity of the given country. The ecological overload (when the ecological footprint is bigger than the biocapacity) brings on the destruction, the decrease and the ruin of the soils, forests, water, flora and fauna, climate etc. , the dispersion of the toxins, garbage. Due to the overload the biocapacity of the Earth is sinking while the human population is growing quickly, so less and less remains for one person. The green graph determines our destiny! (The biocapacity can be increased but usually only by decreasing our footprint, so the primary solution is the population decrease.) The overshoot is not sustainable, the red areas will melt away (crisis, unemployment, increase in price, natural disasters, etc.). The countries are lapsing into the level of their biocapacity, the poverty. The red area on the small graph shows how much the ecological footprint of the given country exceeds the biocapacity.
1. Stage of population explosion: the child mortality rate decreases, the average age increases, the birth rate is still high, the high rate of dependent children causes a big load on the society.
2. Stage of demographical bonus: the rate of the birth decreases, low number of dependent children and inactive elderly, the generation of active adults is big. This means you should reserve for the next stage! BUT: in the case of ecological overload this bonus will not give divident enough, Earth can't offer workplaces, so the unemployment rate increases and unemployed are added to the dependents, burden on the society and make the reservation harder.
3. Stage of aging: the generation of the 1st stage gets elderly but the sustainment of the huge amount of elderly people is supported by the reserves of the previous demographic stage because they had less children so they could reserve more, the few children inherit much more from the elder generation and it makes easier for them to support the elderly.
4. Stage: the large generation will run out, at a lower number of population a harmonic age pyramid can develop which decreases to the sustainability level.
During the demographic transition the rate of active and inactive age population is changing. The transition varies in different regions at different times and ways. To recognize the stages of this transition is very important in order to reserve for the elderly age in the period of the demographical bonus. Where the phase of the demographical bonus starts in an ecologically overloaded situation because of the overpopulation, it will be very difficult to create workplaces for the large number of entrants.
The regions at different demographical stages strongly influence each other as the borders have less and less importance and power during the globalization, and there are balancing processes. The labor market has also globalized, so the workplaces migrate also towards cheaper workforce and higher possible profit. Therefore in the wealthy world the unemployment rate and the number of poor increase, in the poor world the number of the wealthy population increases.
Although the wealthy countries where the population exemplary decreases say that „the ship is sinking in your side” but the wealthy part of the world is pulled down to the poverty by the global population explosion and ecological overload. To ensure the right of family planning is the vital interest of both the poor and the rich in the whole world! The solution is obvious: women's rights, education of girls, availability of contraception means and competency. Our civilization will collapse because of a taboo?