Download
1 / 19
200 likes | 337 Views
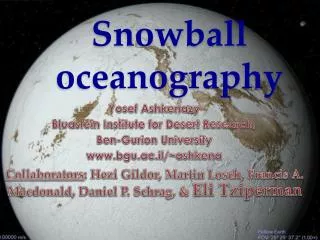
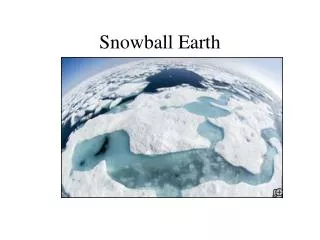
Snowball Earth Roopa Kamesh Matt Beversdorf Kathy Groome. Theory of Snowball Earth. Continents and oceans were covered in ice approximately 600 million years ago.

E N D
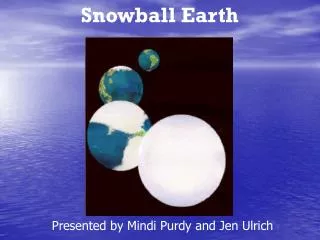
Snowball Earth Roopa Kamesh Matt Beversdorf Kathy Groome
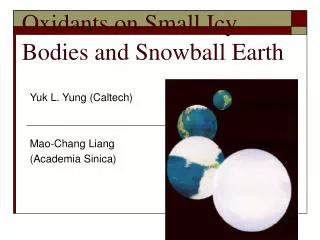
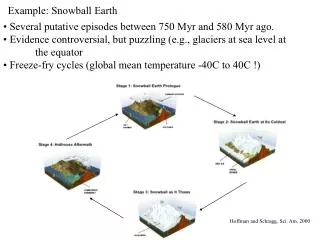
Theory of Snowball Earth • Continents and oceans were covered in ice approximately 600 million years ago. • Earth was in a deep freeze, chemical cycles were halted; carbon dioxide accumulated in the atmosphere causing an extreme greenhouse effect. • Believed to have triggered the explosion of life forms seen in Cambrian fossils
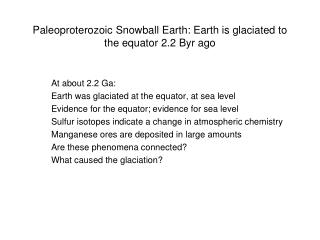
Research Question Is there a correlation between the existing isotope data and unusual deposits during the Neoproterozoic (530-630 Ma) ?
Existing Evidence • Proterozoic Biostratigraphy: Persistence and the Explosion of Life • Glacial Deposits and Carbonate Caps • Isotope Analysis
Proterozoic Biostratigraphy (Fossil Record) Shelly Fauna – mollusks, conical fossils marking the Cambrian transition Acritarchs – organic walled, probably plant origin Ediacarian fossils – oldest known multicellular animal life. Soft bodied, macroscopic invertebrates. Circumglobal Trace fossils – traces and burrows Stomatolites – CaCO3 buildup of algal origin
Geologic Sequence Cap Carbonates are found on top of glacial deposits in the rock layers. Namibia (Hoffman et al. 1998) Mulden Clastics Elandshoek Slope Elandshoek Platform Maieberg Cap Carbonate Ghaub Glacial Deposits Ombaatijie Platform Gruis Ramp Rasthof Cap carbonate Chuos Glacial Deposits Ombombo Ramp (approx 760 Ma)
Hoffman and Schrag pointing to cap carbonate above glacial dropstones.
Stable Isotope Analysis Knoll, 2000 Knoll, 2000 Jacobson and Kaufmann, 1999 CARBON 12/CARBON 13 Plants use the lighter isotope Carbon 12 in photosynthesis. The lower relative abundance of Carbon 13 means the plants were worse off (dying). Evidence in “cap” carbonates OXYGEN Heavy Oxygen-18 is incorporated into minerals. More Oxygen 18 during low temperatures. STRONTIUM Increased Sr86/87 ratio due to increased weathering during glaciation.
Design/Methods • Literature Search for related data Kaufman et al. 1993. The Vendian Record of Sr and C isotopic Variations in Seawater: Implications for Tectonics and Paleoclimate. Earth and Planetary Science letters 120(1993) 409-430. Kennedy et al. 1998. Two or Four Neoproterozoic Glaciations? Geology 26 (12): 1059-1063. • Data Analysis • Create Timeline depicting different stages ranging from Archaen to Phanerozoic • Any significant difference in isotope data over time (ANOVA for 3 different isotopes every 20 My) • Correlation between isotope data at different locations (ANOVA for 3 different isotopes) • Correlation between different isotope data (Spearman rank analysis)
Isotope Data over Time Data grouped by 20 My time periods. (A=520-540 My, I=680-700 My) Oxygen (O18) Strontium (Sr86/Sr87) Carbon 13
C, O and Sr for 5 locations Oxygen (O18) *Low P-value means that they are significantly different Strontium (Sr86/Sr87) Carbon 13
Correlation Between Isotope Data? *Low P-value means that we reject the null hypothesis that there is not a relationship between the variables (independent)
Summary of the Results ANOVA * C, Sr, and O were significantly different over time Indicates one or more climatic changes in conditions from the Archaen to the Phanerozoic. (Does not tell us when or how extreme) * O and Sr were significantly different between locations Tells us that the numbers are different between sites - measurement error or other factor? (Does not tell us if locations show same trend) * C was not significantly different between locations Carbon data was similar for all sites SPEARMAN * Both C & Sr and C & O are not related * O & Sr are related (inverse correlation)
How does it all fit together? (after 6 hours of stress) Walter et al., 2000
Conclusion • We conclude that it is reasonable that a global glaciation occurred around 600 My ago. • This is supported by isotope analysis, which showed that isotopes changed over time over a large area. • The isotopes also correspond with glacial deposits and biostratigraphic data • What do you think?