Download
1 / 2
20 likes | 140 Views
Sqrt abundance replicate 2. Sqrt abundance replicate 1. Nolte-’t Hoen et al., Supplementalry Figure 1. A. Comparative ranking of miRNAs. B. Comparative ranking within total small noncoding RNAs. C.

E N D
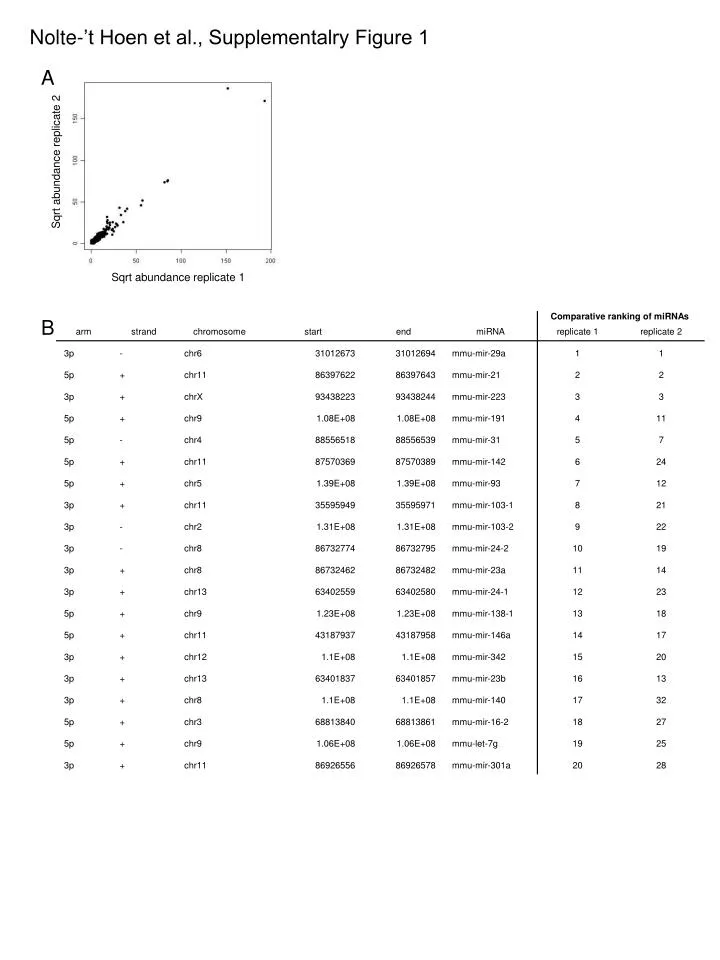
Sqrt abundance replicate 2 Sqrt abundance replicate 1 Nolte-’t Hoen et al., Supplementalry Figure 1 A Comparative ranking of miRNAs B
Comparative ranking within total small noncoding RNAs C Supplemental Figure 1: Reads of two sequencing replicates of shuttle RNA were annotated to known small noncoding RNA transcripts as annotated in Ensembl using the E-miR pipeline.(A) Shown is the correlation between the two sequencing replicates. The plotted values represent the square root of the number of reads per region. A high correlation was observed between the replicates (Pearson correlation 0.97, p-value < 2.2e-16). (B) Table representing the comparative ranking of the most abundant shuttle miRNAs in the two sequencing replicates. The miRNAs were ranked according to the frequency of their occurrence (number of reads). Indicated are the hairpin arm, strand, chromosome positions, and ranking of the 20 most prevalent miRNAs in replicate 1 and the corresponding ranking in replicate 2. Twelve out of the replicate 1 top 20 miRNAs were also found in the top 20 of replicate 2, and 19 out of 20 were found in the top 30 ranked miRNAs of replicate 2, indicating the strong correlation between the datasets. (C) Table representing the comparative ranking of Vault RNA, SRP-RNA, and Y-RNA within the 10 most prevalent small noncoding RNA transcripts in the two sequencing replicates, which were ranked according to the frequency of their occurrence (number of reads). Indicated are the strand and chromosome positions of these RNAs and their highly comparable rankings in replicates 1 and 2.