Download
1 / 36
360 likes | 453 Views
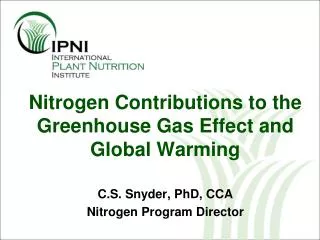
Nitrogen Contributions to the Greenhouse Gas Effect and Global Warming. C.S. Snyder, PhD, CCA Nitrogen Program Director. Acknowledgements. Dr. Tom Bruulsema Dr. Tom Jensen. Background. N is essential to the survival of all life

E N D
Nitrogen Contributions to the Greenhouse Gas Effect and Global Warming C.S. Snyder, PhD, CCA Nitrogen Program Director
Acknowledgements • Dr. Tom Bruulsema • Dr. Tom Jensen
Background • N is essential to the survival of all life • Over 40% of the people on Earth owe their existence to the food production made possible by N fertilizers • “Human alterations of the N cycle have caused a variety of environmental and human health problems ranging from too little to too much reactive N in the environment.” (Woods Hole Research Center) http://www.whrc.org/policy/global_nitrogen.htm
N- ecological & environmental effects eutrophicationof coastal marine ecosystems, freshwater lakes acid rain effects on freshwater and terrestrial ecosystems loss of biodiversity: aquatic and terrestrial ozone creation @ ground-level (leads to loss of agricultural and forest productivity) ozone destructionin stratosphere (increased UV-B radiation on Earth) Contribution toglobal warming(GHGs). Increased health effects include: asthma and respiratory malfunction, pollen production, and increased allergies and asthma bluebaby syndrome risk of cancer and other chronic diseases from nitrate in drinking water risk of a variety of pulmonary and cardiac diseases from production of fine particles in the atmosphere. “Human activity has greatly increased the flux of nutrients through the landscape, roughly doubling the global flux of nitrogen and tripling the flux of phosphorus in the landscape over natural values.” “half the synthetic nitrogen fertilizer ever used on Earth has been utilized since 1985.” Millenium Ecosystems Assessment Nutrient Management (Ch.9)by Robert Howarth & others (2005)
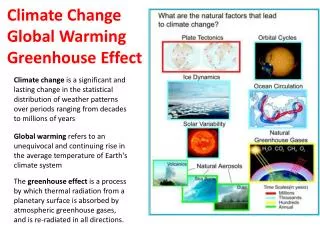
Greenhouse Gases (GHGs)and their sources • Carbon Dioxide (CO2): fossil fuels (oil, natural gas, and coal), solid waste, trees and wood products, and also as a result of other chemical reactions (e.g., manufacture of cement). • Methane (CH4): production and transport of coal, natural gas, and oil; livestock and other agricultural practices and by the decay of organic waste in municipal solid waste landfills. • Nitrous Oxide (N2O): agricultural and industrial activities, as well as during combustion of fossil fuels and solid waste. • Fluorinated Gases: (Hydrofluorocarbons, perfluorocarbons, and sulfur hexafluoride): synthetic, powerful greenhouse gases from a variety of industrial processes. • Sometimes used as substitutes for ozone-depleting substances (i.e., CFCs, HCFCs, and halons). Typically emitted in smaller quantities, but because they are potent GHGs, they are sometimes referred to as High Global Warming Potential gases (“High GWP gases”). GWP = Global Warming Potential N2O x 296 = CO2 equivalent CH4 x 21 = CO2 equivalent Sources: EPA, IPCC
United Nations Educational, Scientific, and Cultural Organization & Scientific Committee on Problems of the Environment http://www.icsu-scope.org/unesco/070424%20(w)%20USPB04%20En.pdf
Public Perception ….. Ag is Bad Actor ….. Affecting Air Quality and Water Quality
World Population Growth in More and Less Developed Countries Billions 20% more people in ~ 20 years Less Developed Regions Food, fiber, and fuel demands will continue to increase …… what will the environmental impact be? More Developed Regions Source: United Nations, World Population Prospects: The 2004 Revision (medium scenario), 2005. http://www.prb.org/Publications/GraphicsBank/PopulationTrends.aspx
Gap Between CO2 Emissions of Developed and Developing Regions (FAO) CO2 emissions per capita, 2002 Global pressures on developed countries are increasing
Best Management Practices to Minimize Greenhouse Gas Emissions Associated with Fertilizer Use IPNI Review Paper (in press) IPNI Better Crops article, Issue 4 of 2007 Greenhouse Gas Emissions from Cropping Systems and the Influence of Fertilizer Management http://www.ipni.net/ppiweb/bcrops.nsf/$webindex/6F2F57CBF1C5209685257394001B2DD0/$file/07-4p16.pdf
Agriculture’s Share of GHG Emissions is Not Increasing Agriculture < 10% of total U.S. GHG
Estimates of N2O Emissions from Cropland in 1995 (adapted from IFA/FAO, 2001) Recently published reports suggest terrestrial and aquatic N2O-N emissions may range from 2 to 5% of “new N”
Food Yield/ Net GWP .01 .09 .02 .02 .02 .02 .01 .01
Range of N2O Emission Among N Sources can Vary Greatly • Report 1 (Stehfast & Bouwman, 2006) • 0 to 46% of applied N • Report 2 (Granli & Bockman, 1994) • 0 to 7% of applied N • Report 3 (Eichner, 1990) • 0 to 7% of applied N • Report 1 • Median among N sources ranged from: 0.26 to 1.56 kg of N/ha
N Rates Above Agronomic Optimum Can Increase Risk of N2O Emission
Loss of NO3 -N to Water Resources May Also Impact N2O Emissions SPARROW - Modeled Estimate of N and P Discharge in Watersheds of the Mississippi R. Basin Kg/ha .01 .01- 0.1 0.1 to 1 1 to 5 5 to 10 >10
How much of the nitrate-N leached into shallow groundwater , or reaching surface water is subject to denitrification and N2O emission ? Water Quality/Quantity Best Management Practices for Florida Vegetable and Agronomic Crops. (2005)
Nitrogen Use Efficiency • “…… estimated NUE for cereal production ranges from 30 to 35%.” Improving Nitrogen Use Efficiency for Cereal Production ( 1999 Agronomy Journal 91:357-363)
N Recovery and NUE are Affected by Other Essential Nutrients
N Loss Consequences Requiring Management Attention • Decreased crop production and profitability • Inefficient land use, reduced performance of other crop inputs, reduced water use efficiency • Water resource contamination • eutrophication: lakes, streams, rivers, estuaries • groundwater contamination • coastal water contamination - urea and harmful algal blooms (neurotoxin poisoning) • Air pollution • Ammonia and particulates, nitrous oxide and NOx (global warming, stratospheric ozone depletion, acid rain)
Nutrient Use Efficiency and Effectiveness: Indices of Agronomic and Environmental Benefit http://www.ipni.net/ipniweb/portal.nsf/0/d58a3c2deca9d7378525731e006066d5/$FILE/Revised%20NUE%20update.pdf
F-amt. nutrient applied, Y- yield of harvested portion with applied nutrient, Y0- yield of harvested portion with no applied nutrient, UH –nutrient content of harvested portion of crop, U –total nutrient uptake in aboveground biomass with nutrient applied, U0 –total nutrient uptake in aboveground biomass with no nutrient applied
Increased Farmer Interest in Better N Management • Increased N costs • Better crop prices • Calibration and verification of newer technologies • Improved farmer skills and availability of professional guidance by crop advisers “The Market” Nov.1, 2007
51% increase in N efficiency 12% increase in N fertilizer use Since 1975: Corn grain produced in the U.S. per unit of fertilizer N used, 1964 to 2005. 1.15 * 0.76 *Application rate for 2004 estimated as avg of 2003 & 2005. Data sources: USDA Ag Chem Use Survey & Annual Crop Production.
Effects of Crop Harvest N Removal on Net Anthropic Nitrogen Input (NANI)
Fertilizer N in FL and GHG Emission 225, 000 x 0.01= 2,250 tons N2O –N emitted (assuming IPCC 1% factor) N x 1.57 = 3,533 tons of N2O N2O x 296 = 1.05 million tons GWP CO2 equivalent All GHGs in FL in 2007 (Adams, FDEP) : 268 million tons CO2 equivalent Portion of total that is “fertilizer N induced” = (1.05/268) x 100 = 0.4% of all GHGs Source: AAPFCO
Fertilizer N BMPs can help minimize potential for residual NO3-N accumulation & losses • N source, rate, placement , and timing …. which may include • Urease inhibitors • Nitrification inhibitors • Slow-release materials • Controlled-release materials • In combination with appropriate, site-specific cropping system and conservation practices • (e.g. conservation tillage, cover crops, vegetative buffers, managed drainage, wetlands, bioreactors, etc.)
http://www.floridaagwaterpolicy.com/BestManagementPractices.htmlhttp://www.floridaagwaterpolicy.com/BestManagementPractices.html http://www.ipni.net/bettercrops http://www.fertilizer.org
CONCLUSIONS • Appropriate fertilizer N helps increase crop biomass to restore & maintain soil organic matter (SOM) • Tillage practices with the least soil disturbance help maintain SOM • Intensive crop management can help minimize GHG emissions, and lower GHG emission/unit of crop or food produced • Fertilizer N contributions to agricultural GHG emissions can range widely, BUT agricultural emissions are relatively small compared to other source emissions • We must continue to strive to improve NUE
Governor Signs Florida Greenhouse Gas Targets • MIAMI: Reuters: July 13, 2007 • "The Republican governors of California and Florida gave the Bush administration the cold shoulder on Friday as Florida set new limits on greenhouse gas emissions and signed cooperation pacts on climate change with Germany and Britain. • Florida targets call for state utilities to reduce GHG emissions: • to 2000 levels by 2017 • to 1990 levels by 2025 and • by 80 percent of 1990 levels by 2050. http://lightblueline.org/node/249
January 2, 2008 • California officials say their 2004 law is tougher than the new national standard. It would have required the auto industry to cut emissions by one-third in new vehicles by 2016 or reach an average of 36.8 mpg.” • Twelve other states — CT, ME, MD, MA, NJ, NM, NY, OR, PA, RI, VT, WA — have adopted the CA emissions standards and the governors of AZ, CO, FL and UT have said they plan to adopt them. The rules also are under consideration in Iowa. • “The auto regulations are a major part of California's global warming law, which aims to reduce greenhouse gases statewide by 25 percent — to 1990 levels — by 2020. Auto emissions account for about 17 percent of the state's proposed reductions.” http://ap.google.com/article/ALeqM5jJH569QSBl-5FfOe4F9liGjADk3gD8TTUJVO0
Dec. 23, 2007 • Eric Waschman- interim director of the Florida Institute for Sustainable Energy at the U. of Florida – champions making ethanol from citrus peels and stems because it's taking advantage of waste from a crop that was going to be grown and harvested anyway. • Ag. Commissioner - Charles Bronson- thinks Florida could grow no less than 30 percent of its annual fuel supply. • He doesn't want farmers to stop growing their staple fruits and vegetables in favor of crops for biofuels. Instead, they should add extra plantings and use that as an energy source http://www.palmbeachpost.com/news/content/business/epaper/2007/12/23/a1f_biomass_1223.html
QUESTIONS ? Please Visit the IPNI Website: www.ipni.net