Download
1 / 8
80 likes | 230 Views
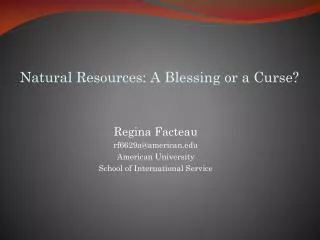
Assessing the Impact of Economic Inequality on Peace. Liat Krawczyk lk2985a@american.edu American University School of International Service. Research Question. What is the impact of economic inequality on peace?

E N D
Assessing the Impact of Economic Inequality on Peace Liat Krawczyk lk2985a@american.edu American University School of International Service
Research Question What is the impact of economic inequality on peace? (Note: Gini value of 0 expresses total equality and a value of 1 maximal inequality GPI=lower values equal more peace) Why do we care? • We need to understand the causes of violent conflict in order to better prevent and respond to mass atrocity. • U.S. foreign policy emphasizes that economic growth moves people away from violent extremism and instability, but looking at other elements helps us a more comprehensive picture of what affects peace- and state-building in order to shape our policies effectively.
Background Information The nexus between economic inequality and violence has been studies for decades. Inequality leads to Less Peace • Discontent arising from the perception of relative deprivation • Economic inequality is endemic to revolutions as groups perceive they have everything to gain, and nothing to lose from conflict Inequality leads to More Peace • Inequality yields a greater propensity for concessions as deprived group will avoid risk of being worse off • Poor people are too busy surviving and will not fight to change status quo. • Actors are more likely to engage in fighting when they have the resources to challenge the status quo
Data • Interval-ratio level data • Dependent variable: • 2010 Global Peace Index (GPI) [composite index of 23 indicators] • Independent Variables • Gini Coefficient [proxy for inequality] • GDP per Capita (tests absolute versus relative poverty) • Higher Education Enrollment Rates [proxy for elite] • Democracy • Youth Bulge • Gender Inequality (tests other qualitative inequalities) • Unemployment Source: Vision of Humanity, 2010
Descriptive statistics • GDP per Capita, Higher Education Enrollment and Unemployment Rate: SD >/ almost the mean, indicating great variance. • GDP median is significantly smaller than the mean, reflecting that the curve is positively skewed.
| gpi gini unempl~t gdppc higher~n demo gender~y -------------+--------------------------------------------------------------- gpi | 1.0000 | | gini | 0.3229* 1.0000 | 0.0001 | unemployment | 0.1800* 0.2209* 1.0000 | 0.0303 0.0076 | gdppc | -0.5675* -0.4321* -0.2157* 1.0000 | 0.0000 0.0000 0.0092 | highereduc~n | -0.4452* -0.4555* -0.1451 0.4985* 1.0000 | 0.0000 0.0000 0.0826 0.0000 | demo | -0.5589* -0.2074* -0.0876 0.5644* 0.6241* 1.0000 | 0.0000 0.0112 0.2948 0.0000 0.0000 | genderineq~y | -0.3832* -0.0585 -0.0644 0.3710* 0.4488* 0.6241* 1.0000 | 0.0000 0.5275 0.4903 0.0000 0.0000 0.0000 | youthbulge | 0.4238* 0.4718* 0.1393 -0.5100* -0.7698* -0.6879* -0.5035* | 0.0000 0.0000 0.0970 0.0000 0.0000 0.0000 0.0000 | | youthb~e -------------+--------- youthbulge | 1.0000 Bivariate Correlations Purple: Moderate Association Red- Weak Association *All Significant
Regression Analysis Model 1 Model 2 Model 3 Model 4 Gini Coefficient 0.0163*** 0.0126** 0.00816* (3.84) (3.09) (2.40) Youth Bulge -0.00989 (-1.12) Gender Inequality -0.929 (-1.26) Political Democracy -0.0655** -0.0727*** -0.0707*** (-2.75) (-4.31) (-4.12) Lhigher Education Enroll 0.0961* 0.0697* 0.0559 (2.43) (2.16) (1.73) lGDP per Capita-0.142*** -0.139*** -0.148*** (-4.62) (-4.92) (-5.21) lunemployment -0.0187 (-0.42) constant 1.367*** 3.676*** 3.062*** 3.493*** (7.74) (5.88) (12.40) (20.33) r2 0.104 0.452 0.4510.429 N 149 116 148 148 * p<0.05, ** p<0.01, *** p<0.001 Note: Model 1 isolates our key variable: the Gini Coefficient Bolded Values in Model 2 are the values that are significant and make up Model 3. The Red Value in Model 3 indicates the highest adjusted R-Squared. Model 4 tests the value of the model, without the Gini Coefficient, the differences in the R-Squared of Models 3 and 4 show the value of Gini in the BLUE model as accounting for only 2.2% variability in GPI.
Conclusion • We can reject the null hypothesis: there is an association between GPI and the Gini Coefficient • As Predicted, there is a positive association between GPI and Gini: as income inequality increases, there is less peace. • We see from the BLUE model (Model 3), that the four variables that best explained variation in GPI were the Gini coefficient, Democracy, the log of Higher Education Enrollment and the log of GDP per Capita. • Surprises: As Higher Education Enrollment increases, there is less peace. Possible interpretation: if we use this variable as a proxy for an elite, a higher percent of elite may cause income disparities to be more evident, thus fueling more resentment and increasing conflict. Policy Recommendations: • Peace prevention efforts must include inequality-reduction measures not only increase in GDP, as growth does not imply equitable development. • There is a need to shift towards recognition of poverty as a multifaceted, multidimensional phenomenon and increasingly measure the proportion of median per capita yearly income to reflect inequality.”