Download
1 / 16
160 likes | 264 Views
This analysis focuses on the Extraterrestrial High-Energy (EHE) events detected by IceCube, detailing the Estimated Number of Photo-Electrons (NPE) per Digital Optical Module (DOM) using FADC and ATWD systems. The study presents a roadmap to analyze the NPE saturation, energy distribution, signals vs. background, and preliminary event selection. Utilizing Empirical Models, IceSim, and in-ice data, the research aims to enhance understanding of EHE events through data analysis and empirical modeling. Evaluation of the Muon bundles and building empirical models are key components, along with addressing cosmic ray intensity and composition uncertainties. The study emphasizes the importance of early publication to win acknowledgment for the working group's efforts.

E N D
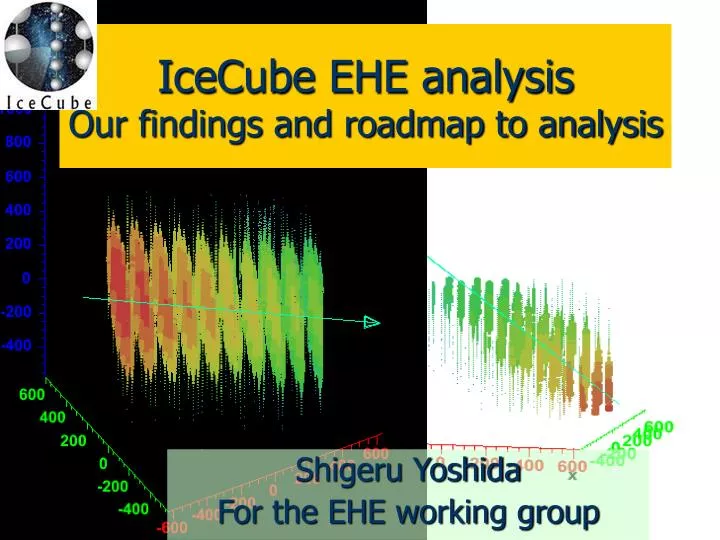
IceCube EHE analysisOur findings and roadmap to analysis Shigeru Yoshida For the EHE working group
DOM response to high NPEs ATWD or FADC? “EHE specific” response! Estimated number of photo-electrons per DOM Log10 (FADC based estimated NPE) Red: DOM of which ATWD charge is larger Blue: DOM FADC is larger Log10 (ATWD based estimated NPE) Npe saturation Npe saturation Log10 (FADC estimated NPE) Log10 (ATWD estimated NPE) Log10 (MC Truth NPE) Log10 (MC Truth NPE)
t m contained contained Log Npe GZK m Atmospheric m GZK t E-1 fluxes 107 1010 [GeV] 107 1010 [GeV] 107 1010 [GeV] NPE Energy Distribution
NPE Distribution Distribution difference between the signals and background! GZK m GZK t Atmospheric m
Zenith Angle Distribution down up • Signals peak at horizontal direction • Background distribute over down-going region GZK m GZK t Atmospheric m
Preliminary Event Selection Atmospheric m GZK m GZK t
Event Rate with completed detector GZK m GZK t Atmospheric m GZK m GZK t Atmospheric m IceCube Preliminary GZK m0.35events/year GZK t0.31 events/year Atmospheric m0.033events/year GZK: S. Yoshida et. al. (1997) ApJ 479:547 (m=4, Zmax=4)
Roadmap to analysis Atmospheric m BG Energy GZK m/t Signal Empirical Model Extrapolate to signal domain Tune Npe IceSim IceSim In-Ice data Standard Candle 9-strings unblinded data Eff. Area Cos(zenith) Log(Npe) Cos(zenith) NDOM Energy Log(Npe) Log(Npe)
9-strings working data NDOM >80 NDOM >80 Npe>104 Npe>104
9-strings working data Needs statistics ! to understand Intensity(Npe, zenith), DOM response in EHE regime Npe>104 ~ 500 Events/yr
9-strings“EHE”REAL DATA Build Empirical Model Cos(zenith) IceSim Log(Npe) Muon bundles 1PeV bundle of 1000 muons (1TeV/muon) • Npe only wouldnotbe able to resolve tracks • We donotknow cosmic ray intensity in EHE • We donotknow cosmic ray composition in EHE • Corsika hasnotreconstructed AGASA/Auger data
Why no problem in unblinding? Signal stats in the following data is by far large. Almost independent confirmation!! Expected Event Rate [/year] Y2008 x 1.5 Y2007 x 2 This Year
This cut? Or this cut? This cut? Or this cut? Why no problem in unblinding? Background and Signals are so different in Energies (Npe’s) and cos(1st-guess zenith)
Sensitivity/Bound Quasi-differential method This is MODEL independent!! Bound: energy dependent!! S. Yoshida et. al. (2004) Phys. Rev. D 69 103004
Beyond Npe and First-guessEnergy/Geometry reco Waveform-based likelihood (proposed by Gary) Utilize unscattered photon hits? (suggested by Lutz in 2004) cos(1st guess q) cos(reco q) Including more non-contained events Log(Npe) Log(Energy)
Introducing “Yoshida” bottle(s) Your WG wins them if you publish your results earlier than anybody else! Our Bread and Butter Photo by David Boersma