Download
1 / 14
140 likes | 287 Views
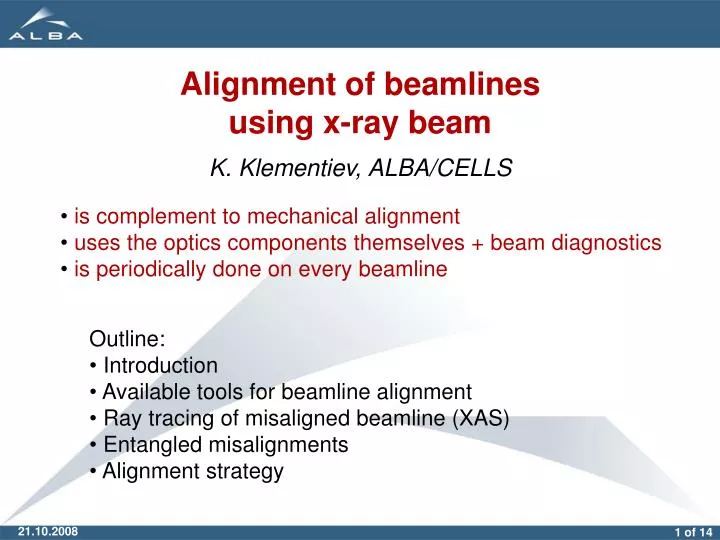
Alignment of beamlines using x-ray beam K. Klementiev, ALBA/CELLS. is complement to mechanical alignment uses the optics components themselves + beam diagnostics is periodically done on every beamline. Outline: Introduction Available tools for beamline alignment

E N D
Alignment of beamlinesusing x-ray beamK. Klementiev, ALBA/CELLS • is complement to mechanical alignment • uses the optics components themselves + beam diagnostics • is periodically done on every beamline Outline: • Introduction • Available tools for beamline alignment • Ray tracing of misaligned beamline (XAS) • Entangled misalignments • Alignment strategy
Introduction What others have done? • There are a very few papers and web-pages on the topic “Alignment of synchrotron beamlines”. Most of them are aimed at automatic alignment. • There is The Automatic Beamline Alignment Projectin ESRF (Olof Svensson et al). It is aimed at algorithms and software. What I intend to present? • not an automatic procedure, but rather basic understanding of misaligned optics; • to stress the importance of ray tracing for studying misalignments of various kind; • to notice the usefulness of the monochromator as a kind of diagnostics device (never mentioned in literature, although some people use this); • a (general) strategy for initial beamline alignment.
2) z 3) x y 5) 5) slit slit z y x XES FSM FSM FSM FSM slit intensity intensity pin-hole array 5) 1) 1) 1) 1) 7) 4) 4) 6) Available tools for beamline alignment benttoroid FM sample side DCM piezo on 2nd crystal MPW, 1m, period 80mm K=13, B=1.74T Ec=10.4 keV mask 1.5h×0.25v mrad2 low-E filters bent CM top Z, X, pitch, yaw, roll, R Bragg Z, 2 rolls(miscuts) Z, pitch, yaw, roll, R FSMs and/or BPMs energy scan rocking curve (piezo- or motor- actuated) intensity monitors slit scans wave front analysis (pin-hole array) secondary monochromator (x-ray emission spectrometer)
Fluorescence screen monitors screen view tilt = df Dx ~ 2L·dq·df Dz ~ 2L·dq + 2dz roll df pitch dq height dz FSMs are of limited usage for initial alignment because: • To detect image tilts due to a roll of ~1 mrad, the screen resolution must be ~10 µm. • In the initial alignment the screen itself has unknown Dx and Dz. • Some misalignments give correlated shifts of the image, e.g. pitch and height here. • All the upstream optic elements contribute to the image. Nevertheless, FSMs are useful for: • localizing big misalignments, • detecting relative shifts during energy changes, • development of alignment strategy basing on the image shape, • fine alignment basing on wave front analysis.
Rocking curves • Fine pitch scan of the 2nd crystal, ±0.01º (350 µrad): wide enough even at low energy 2.4 keV with Si(111). • Two intensity monitors: Why two? If you have only one, you will only notice the asymmetry of the rocking curve, not the shift. • Remember that the detuning of one of the crystals splits the energy band passed through the monochromator. If you detune the 2nd crystal, one of the two sub-bands stays at the nominal energy, the other is shifted proportionally to the detuning angle (see also [Schulte-Schrepping & Drube, NIMA 467–468 (2001) 396]). For the same intensity drop this shift is stronger at higher energies when considered absolutely but stronger at lower energies when considered relative to the Darwin width, i.e. it is more visible at lower energies. • right after the monochromator, • at the experiment. • to decouple intensity and position for the piezo-detuning feedback system; • to detect the rocking curve shifts for alignment (see below). Si 111, 2.4 keV Si 111, 9 keV
Ray tracing of misaligned beamline (XAS) • Click the buttons below to invoke the corresponding presentations. • Ray tracing was done at 4 different energies (see the 4 columns) • For each energy (column) there are two animated beam images: • behind the detuned optical element; • at the sample position. All animations are synchronized, i.e. for the same detuning at a time. • The rocking curves are recorded at the two positions: • after the DCM, • at the sample. • The rocking curves are shown as • two 3D surfaces (for “a” and “b” rocking curves) in order to see if there is a maximum over the detuning coordinate, • as usual 2D plots (in the lowest row) to mimic the real measurements of rocking curves; the “a” rocking curves are normalized to 1 and the “b” rocking curves are normalized to ½. Focusing Mirror (OpticalAlignment-3-FM.ppt) CollimatingMirror(OpticalAlignment-1-CM.ppt) DCM(OpticalAlignment-2-DCM.ppt)
fixed hardly distinguishable(next slide) Ray tracing. Summary Collimating Mirror DCM Focusing Mirror similar but ~no defocusing and beam cut at small Bragg angles (high E) height 1st or 2ndXtal height low E height low E ~no defocusing; maximum → ~0.5 mm small hor. defocusing; maximum → ~0.5 mm DCM height pitch no changes except beam cut at small Bragg angles (high E) low E high E asymmetric vertical intensity profile is not seen in the real white beam! pitch low E 1st Xtal roll vert. defocusing; no maximum (if within exit slit aperture); Dx tanq·df energy dependent hor. defocusing; weak maximum → ~0.1 mrad hor. defocusing; weak max → ~0.2 mrad vert. defocusing; no maximum; image tilt → ~1 mrad roll roll low E: high E: vert. defocusing; no maximum; image tilt → ~1 mrad lateral same yaw no defocusing; weak max at high E → ~1 mrad Xtal miscuts yaw vert. defocusing; image tilt → ~1 mrad; defocusing, no maximum; similar to FM roll & lateral bending R similar vert. defocusing; no maximum; E-analysis → ~10% R0 bending R vert. defocusing; no maximum; defocusing
Correlated misalignments FM R = ½·R0 ..2·R0 R0=5.46 km CM R = ½·R0 ..2·R0 R0=8.56 km FM lateral = ±2 mm FM roll = ±25 mrad FM yaw = ±0.5 mrad full beam 1.5h×0.25v mrad2 vertically reduced beam 1.5h×0.025v mrad2 horizontally reduced beam 0.15h×0.25v mrad2
Alignment flow diagram 0 align beamline low heat load set nominal CM pitch set nominal DCM height and gap set nominal FM pitch and height set CM roll=0 set CM yaw=0 align CM height + FM height + FM pitch(flow diagram 1) high heat load:750 W absorbed by 1st Xtal align DCM rolls and miscuts(flow diagram 2) align DCM height(flow diagram 3) align FM roll + FM lateral + FM yaw + CM R + FM R(flow diagram 4) end
Alignment flow diagram 1 align CM height + FM height + FM pitch measure rocking curves (RCs) at high E measure RCs at low E align FM pitch by lookingfor symmetric and not shiftedRCs at high E align CM height by looking for symmetric RCs at low E what do the RCs look like? low E high E high E: symmetric low E high E: symmetric low E: symmetric and shifted high and low E: symmetric and not shifted align FM height by lookingfor intensity maximum end
Alignment flow diagram 2 align DCM rolls (miscuts) take “beam image” at the sample at high E Dx = 2L·tanq·df. E.g. if you have 30 µrad roll change when you translate the 2nd Xtal and L=15m: Dx~1mm. go to low E. Important! Use calibration curve“roll vs. 2nd Xtal translation” do 2D scan roll1 roll2 bylooking for maximum intensity take “beam image” at the sample at low E reduce the vertical exit slitdown to the high E image size what do the images looklike? low E high E high and low E: same horizontal position end
Alignment flow diagram 3 align DCM height go to high E(small Bragg angles) scan DCM height to find the two positions when the footprint is out of the Xtal surface(seen as decrease of intensity); take the middle of the two end
Alignment flow diagram 4 align FM roll + FM lateral+ FM yaw + CM R + FM R set FM roll=0 take “beam image_full” at the sample at arb. Ewith widely open exit slit reduce vertical exit slitand take “beam image_hor” optimize FM lateral1+ FM lateral2by doing 2D scan and looking for max intensity optimize CM R and FM Rby doing 2D scan and looking for max intensity open vertical exit slitreduce horizontal exit slitand take “beam image_vert” which beam shape givesthe stronger beam size reduction in vertical? make horizontal beam make horizontal beam no reduction end
Q&A What are the generalities for all beamlines ? • Rocking curves are asymmetric under motion of mirrors and crystal into/out of the beam. E.g. if you have an intensity monitor upstream your KB system, you can easily decouple at least 2 of the N (=7? 8?) degrees of freedom. • Miscut and roll misalignment in crystals lead to energy-dependent horizontal shifts. This presentation is about a hard x-ray beamline. What would differ for a soft one? • Don’t know. How to repeat the ray tracing for another beamline? • The Matlab scripts are freely available. Prepare Shadow projects for different energies in the way that the OE positions are fixed and coincide with the physical ones. Ask me for further help. Outlook • Ray tracing with the pinhole array at defocusing/de-collimating conditions and thermal bumps. • Programs for pinhole image analysis + inverse problem. May I have a student for this? • Eventually, automatic beamline alignment based on the pinhole images. Thanks • to J.Nicolás for introduction into the analysis of the imaging properties by means of the path function. Using his approach (ask him for the article) and the tools like Mathematica one can analyze the images without ray tracing. I don’t know what is easier though. 19.09.2008