Download
1 / 1
10 likes | 109 Views
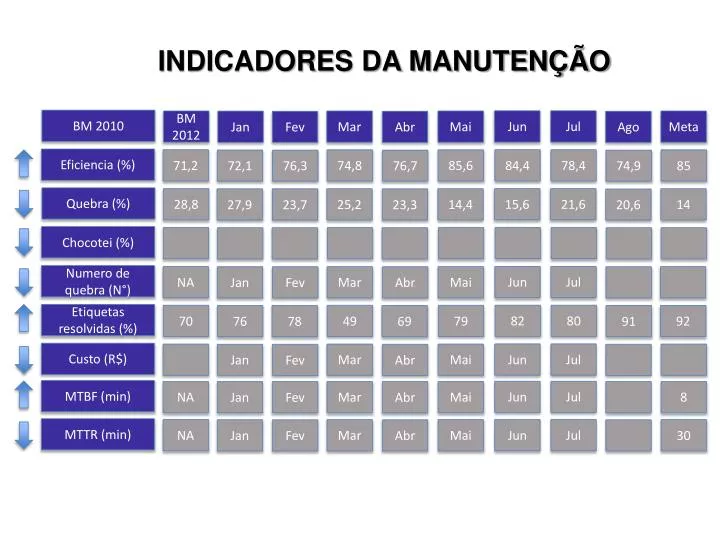
INDICADORES DA MANUTENÇÃO. BM 2010. Jun. Jul. BM 2012. Mar. Mai. Meta. Jan. Fev. Abr. Ago. Eficiencia (%). 84,4. 78,4. 71,2. 74,8. 85,6. 85. 72,1. 76,3. 76,7. 74,9. Quebra (%). 15,6. 21,6. 28,8. 25,2. 14,4. 14. 27,9. 23,7. 23,3. 20,6. Chocotei (%).

E N D
INDICADORES DA MANUTENÇÃO BM 2010 Jun Jul BM 2012 Mar Mai Meta Jan Fev Abr Ago Eficiencia (%) 84,4 78,4 71,2 74,8 85,6 85 72,1 76,3 76,7 74,9 Quebra (%) 15,6 21,6 28,8 25,2 14,4 14 27,9 23,7 23,3 20,6 Chocotei (%) Numero de quebra (N°) Jun Jul NA Mar Mai Jan Fev Abr Etiquetas resolvidas (%) 82 80 70 49 79 92 76 78 69 91 Custo (R$) Jun Jul Mar Mai Jan Fev Abr MTBF (min) Jun Jul NA Mar Mai 8 Jan Fev Abr MTTR (min) Jun Jul NA Mar Mai 30 Jan Fev Abr