Download
1 / 23
240 likes | 416 Views
High Speed Digital Signal Path Design for a 40 Gb /s Optical Receiver. European ADS User’s Group Meeting Boeblingen , May 14-15 2009. Contents. Trends in Fiber Optics Optical Receiver Modul with 4x 10Gb/s High Speed Signal Path Transimpedance Amplifier (TIA) Output stage IC Bondwire

E N D
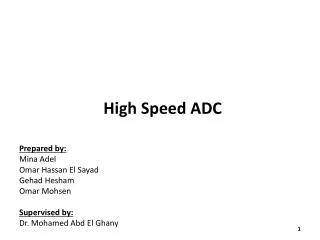
High Speed Digital Signal Path Design for a 40 Gb/s Optical Receiver European ADS User’s Group Meeting Boeblingen, May 14-15 2009 KD 5/18/2009
Contents • Trends in Fiber Optics • Optical Receiver Modul with 4x 10Gb/s • High Speed Signal Path • Transimpedance Amplifier (TIA) Output stage • IC Bondwire • Package Feedthrough • Flex Foil Circuit • Test board interconnection & Test Board • RF Path in Frequency Domain • RF Path in Time Domain • Measurement Data: Eye diagram & TDR • Conclusion
Trends in Fiber Optics Standardization Activities • IEEE HSSG 10G 40 G 100 G • QSFP – MSA 4x 5 G; 4 x 8 G; 4 x10 G • USB 3.0 5G • XMD – MSA ROSA/TOSA up to 10 G • XLMD –MS ROSA/TOSA up to 40 G • Active Optical Cable 12 x 10G
Trends in Fiber Optics 100 G and 40 G Form Factors for Transceivers 4x10Gb/s
Optical Receiver Module with 4x 10Gb/s Fiber Flex Foil Package www.cubeoptics.com
High Speed Signal Path Flex foil – Test Board transition RX Module Bottom side up Flex foil Test Board SMD Connector
High Speed Signal Path Signal path divided in section to create models RF out RF in 50Ohm Packageto FlexFoil transition Flexto Test Board transition Test board Flex foil circuit TIA output stage Bond wire 50Ohm V0 Vtia Vbw Vpkg Vflex Vtb Vout
TIA Output Stage: Linear Circuit Model TIA Chip Channel simulation source linear transistor model CML output stage
Bond Wire Model: 3D EM Simulation Model TIA Bond wire Glass Metal pin (differential feedthrough) S-Parameter extracted from EM simulation 3D Model
Package Feedthrough: 3D EM Simulation Metal base Glass Metal Pins Mag (SDD11) Flex foil circuit S-Parameter extracted from EM simulation
Flex Foil Circuit: 2.5D EM Simulation Model Flex foil circuit layout in ADS one RF path copied and simulated in Momentum Polyimide: 50um, Cu T=36um, 50um Cover layer Coupled microstrip: w=70um, s=250um, Zdiff=100
Test Board Interconnection RF critical section copied to Momentum (use Utility) Layout in Allegro PCB Flex circuit on top Test board Momentum 3D view
Test Board: ADS Line Models line splitter(*) Microstrip line differential line (*) Line splitter model created with Momentum PCB cut view
RF Path in Frequency Domain TIA Output stage omitted Simulation set up in ADS
RF Path in Frequency Domain Vbw Vpkg Vflex +1.2dB loss RF out RF in 50Ohm Packageto FlexFoil transition Flexto Test Board transition Test board Flex foil circuit TIA output stage Bond wire 50Ohm V0 Vtia Vbw Vpkg Vflex Vtb Vout Vtb Vout each section ideal terminated +1.8dB loss
RF Path in Time Domain Models defined in frequency domain and simulated in time domain using convolution
RF Path in Time Domain RF out RF in 50Ohm Packageto FlexFoil transition Flexto Test Board transition Test board Flex foil circuit TIA output stage Bond wire 50Ohm V0 Vtia Vbw Vpkg Vflex Vtb Vout
Measurement Data: Eye Diagram Flex line with Cu receive opt. Power -12dBm sensitivity -18dBm (BER=10E-12) Flex line with Ni/Au plating Flex line has Ni/Au plating Ni is a ferromagnetic conductor smaller skin depth = higher loss
Measurements Data: TDR Flex ctr Test Board SMA AC Cap. Transition to Flex
Conclusion • First samples: full functional, acceptable sensitivity • Bond wire interconnection & package ok • Issues identified by measurements and simulations: • Test board to flex circuit transition too much reflection • Flex circuit loss to high • Test board traces too long
Results after Redesign • Test board to flex circuit transition improved (new concept) • Flex circuit loss improved (no cover layer) • Test board traces shorted (approx. half length) sensitivity < -19.0dBm @ BER = 1E-12 (1 to 1.5dB improvement)
Product Design Methodology • Predict performance early in the design cycle by creating models for each component, critical net and entire system and by performing local and system simulation. • Use measurements throughout the design cycle to reduce risk and increase confidence to the quality of predictions. Eric Bogatin