Download
1 / 7
70 likes | 81 Views
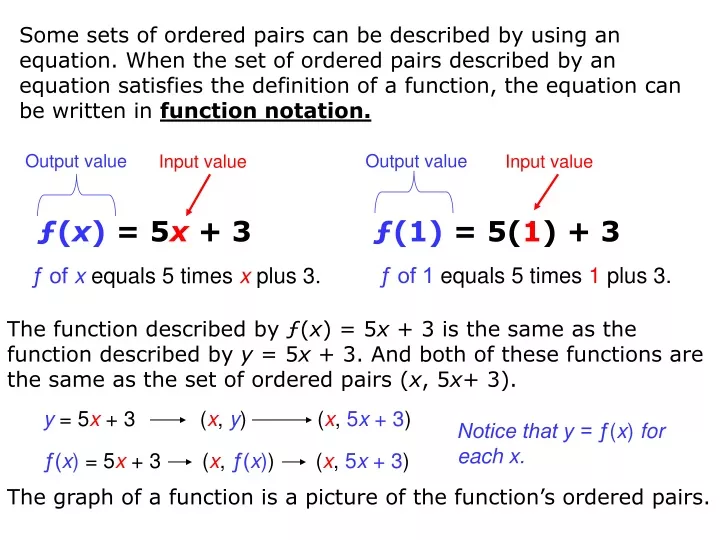
Some sets of ordered pairs can be described by using an equation. When the set of ordered pairs described by an equation satisfies the definition of a function, the equation can be written in function notation. Output value. Output value. Input value. Input value. ƒ ( x ) = 5 x + 3.

E N D
Some sets of ordered pairs can be described by using an equation. When the set of ordered pairs described by an equation satisfies the definition of a function, the equation can be written in function notation. Output value Output value Input value Input value ƒ(x) =5x+ 3 ƒ(1) =5(1)+ 3 ƒ of 1 equals 5 times 1 plus 3. ƒ of x equals 5 times x plus 3. The function described by ƒ(x) = 5x + 3 is the same as the function described by y = 5x + 3. And both of these functions are the same as the set of ordered pairs (x, 5x+ 3). y = 5x + 3 (x, y) (x, 5x + 3) Notice that y = ƒ(x) for each x. ƒ(x) = 5x + 3 (x, ƒ(x)) (x, 5x + 3) The graph of a function is a picture of the function’s ordered pairs.
For each function, evaluate ƒ(0), ƒ , and ƒ(–2). For each function, evaluate ƒ(0), ƒ , and ƒ(–2). ƒ = 8 + 4 =10 ƒ(0) = 3 ƒ = 0 ƒ(–2) = 4 Ex 1: ƒ(x) = 8 + 4x Substitute each value for x and evaluate. ƒ(0) = 8 + 4(0) =8 ƒ(–2) = 8 + 4(–2)=0 Use the graph to find the corresponding y-value for each x-value.
In the notation ƒ(x), ƒ is the name of the function. The output ƒ(x) of a function is called the dependent variable because it depends on the input value of the function. The input x is called the independent variable. When a function is graphed, the independent variable is graphed on the horizontal axis and the dependent variable is graphed on the vertical axis.
Reading Math A function whose graph is made up of unconnected points is called a discrete function. Ex 2: Graph the function. {(0, 4),(1, 5), (2, 6), (3, 7), (4, 8)} Graph the points. Do not connect the points because the values between the given points have not been defined.
Example 2B: Graphing Functions Graph the function f(x)= 3x – 1. Make a table. Graph the points. Connect the points with a line because the function is defined for all real numbers.
The algebraic expression used to define a function is called the function rule. The function described by f(x) = 5x + 3 is defined by the function rule 5x + 3. To write a function rule, first identify the independent and dependent variables. Ex 3: A carnival charges a $5 entrance fee and $2 per ride. Write a function to represent the total cost after taking a certain number of rides. Letrbe the number of rides and let C be the total cost in dollars. The entrance fee is constant. First, identify the independent and dependent variables. Cost depends on the entrance fee plus the number of rides taken Dependent variable Independent variable Cost = entrance fee + number of rides taken C(r) = 5 + 2r Replace the words with expressions.
A carnival charges a $5 entrance fee and $2 per ride. What is the value of the function for an input of 12, and what does it represent? Substitute 12 for r and simplify. C(12) = 5 + 2(12) C(12) = 29 The value of the function for an input of 12 is 29. This means that it costs $29 to enter the carnival and take 12 rides.