Download
1 / 118
1.18k likes | 1.29k Views
Team-Initiated Problem Solving (TIPS). Developed by: Rob Horner, Steve Newton, & Anne Todd University of Oregon Bob Algozzine & Kate Algozzine University of North Carolina at Charlotte. Rebecca Mendiola PBIS Coordinator, District and School Support Services. Themes & Assumptions.

E N D
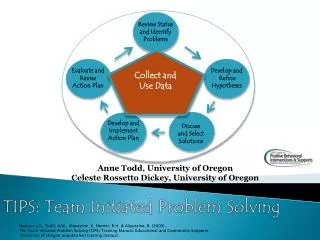
Team-Initiated Problem Solving (TIPS) Developed by: Rob Horner, Steve Newton, & Anne Todd University of Oregon Bob Algozzine & Kate Algozzine University of North Carolina at Charlotte Rebecca Mendiola PBIS Coordinator, District and School Support Services
Themes & Assumptions • Decision making is aided by access to data (“data-based decision making”- DBDM) • PBIS Team meetings are a major context for DBDM • Providing instruction on how to embed DBDM in a problem-solving model (TIPS) will result in problem solving that is • Thorough • Logical • Efficient • Effective • Structure of meetings lays foundation for efficiency and effectiveness
Organizing SWIS Data for Decision-making • Universal Screening Tool • Proportion of students with • 0-1 Office Discipline Referrals (ODRs) • 2-5 ODRs • 6+ ODRs • Progress Monitoring Tool • Compare data across time • Prevent previous problem patterns • Define Problems with precision that lead to solvable problems
Using the Referrals by Student report as a Universal Screening Tool
Using office discipline referrals as a metric for universal screening of student social behavior 6+ office discipline referrals 2-5 office discipline referrals ~5% ~15% 0-1 office discipline referral ~80% of Students
Using ODRs to Identify Problems • Goal • Identify problems empirically • Identify problems early • Identify problems in a manner that leads to problem solving not just complaining Build a picture for the pattern of office referrals in your school. Compare the picture with a national average Compare the picture with previous years Compare the picture with social standards of faculty, families, students.
Problems & Problem Solving PBIS Teams focus on social and academic problems Problem – Difference between expected/desired student behavior & current student behavior Problem identification - Finding a difference & making decision about whether it is significant enough to require team action now Problem solving – Figuring out how to eliminate or reduce difference
Total Office Discipline Referrals as of January 10 Total Office Discipline Referrals
SWIS summary 2008-2009 (Majors Only)3,410 schools; 1,737,432 students; 1,500,770 ODRs
Comparing a Specific Elementary School to the National Average
Activity #1 How many students does your school have? _____ Your school has _____ times more than 100 students So, you might expect your Major ODRs per school day to be about _____ times greater than .34 (for Elementary) OR .85 (for Middle Schools) OR 1.06 (for K-8/12)_____ X .34 (or .85; or 1.06) = _____ Major ODRs per school day Record the absolute values on your TIPS worksheet
Start with the ODR/Day/Month Graph Use the information in the data to build a narrative that draws the team into problem solving. Be descriptive Link local data to national patterns Tie the data back to local conditions/events.
Elementary School 465 students (465/ 100 = 4.6 X .34= 1.56) Our rate of problem behavior has been above the national average for schools our size for 9 of 10 months this year. There has been a decreasing trend since Dec.
Finding Differences(Identifying Trends of the Problem) • Look for Difference Between… • A “desirable” trend - Major ODRs per school day per month are decreasing, or are flat at an acceptable level, and • An “undesirable” trend – Major ODRs per school day per month are increasing, or are flat at an unacceptable level
Our rates of problem behavior are below the national average for a school our size. We have an increasing trend during the past five months Here’s an Elementary School with 200 StudentsIs There a Problem? How About the Trend? 2 X .34 = .68
Activity #2 • Use the 08-09 SWIS data summary to determine if you have a problem with majors only • average Major ODRs per school day for all the months of this school year, AND the average Major ODRs per school day for all the months of the previous school year • Develop a verbal statement about these data to answer • Do you have a problem? • Do we have trends?
What About… Minors Only? • You can use the data on the next slide to figure out how your school is doing compared against the national average for… • Minors per school day
SWIS summary 2008-2009 (Minors Only)2,582 schools; 1,283,526 students; 1,018,726 ODRs
Activity #3 • How many students does your elementary school have? _____ • Your school has _____ times more than 100 students • So, you might expect your Minors per school day to be about _____ times greater than .47 _____ X .47 = _____ Minors per school day • How is your school doing compared against national average for Minors per school day for an elementary school of your enrollment size?Use your SWIS data summary to draw in the line for the national average. • Develop a verbal statement about these data to answer • Do you have a problem? • Do we have trends? • Record a statement about the data on your TIPS worksheet
“Everything is vague to a degree you do not realize till you have tried to make it precise.” –Bertrand Russell
Identification of Problem(for example...) Our average Major ODRs per school day per month are higher than national average for a school of our enrollment size Our average ODRs per school day per month are higher this year than for corresponding months of previous year Our average ODRs per school day per month are showing an increasing trend Faculty, parents, and students say our ODR levels are too high
More Precision Is Required to Solve the Identified Problem • Define problem by identifying What problem behaviors are involved in ODRs • Clarify problem by identifying • When ODRs are occurring (time of day) • Where ODRs are occurring (location) • Who is engaging in problem behaviors that result in ODRs
Problem Statements Write a “problem statement” that specifies the precise nature of the problem The more Ws (what, when, where, who, why) you incorporate into the problem statement, the more precise the problem statement will be The more precise the problem statement, the easier it will be to generate a solution that “fits” the problem
Use Schoolwide Information System (SWIS) Data to Achieve Precision
Defining the ProblemWhat Problem Behaviors are Occurring? Is there one problem, clusters of problems, many problems? How do the problem behaviors link to the SW expectations?
Is there one problem, clusters of problems, many problems? How do the problem behaviors link to the SW expectations?
Disrespect is our most frequent problem behavior. We also have incidents of fighting and harassment
We have many instances of disrespect, aggression/fighting. technology violations, tardies, harassment, lying, skipping, and inappropriate language
Clarifying the ProblemWhen Are Problem Behaviors Occurring? Is there one time period, clusters of time periods, many time periods throughout the day? How do the problem times link to the schedule of activities?
Is there one time period, clusters of time periods, many time periods throughout the day? How do the problem times link to the schedule of activities? We have spike in problem behavior between 9:45-10:15 and at 2:15
Are there problems in one location, clusters of locations or many locations? We have problems in the classroom and on the bus Clarifying the ProblemWhere Are Problem Behaviors Occurring?
Problem behaviors are occurring in the classroom and a few in hall and on playground
Clarifying the ProblemWho Is Engaging in Problem Behaviors? 90% of our students have had 0-1 ODR this year. We have 8 students with 2-5 ODRs and 3 students with 6 +
Three students with 6+ ODRs, 5 with 2-5 ODRs and lots of students with none
Activity #4 Review the SWIS data summary and determine what, where, when problem behaviors are occurring and who are the students contributing to the problem (for majors or minors) Record your problem statement for what, where, when, by whom, on your TIPS worksheet
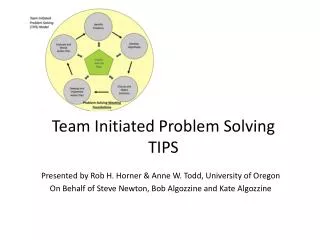
Achieving a Precise Problem Statement 1. Identify the problem (See: Average Referrals Per Day Per Month) q 2. Define and clarify the problem (See: Referrals by Problem Behavior, Time, Location, & Student) q 3. Confirm (or disconfirm) logical inferences (See: Custom Reports) q 4. Write a precise Problem Statement