Download
1 / 26
560 likes | 1.24k Views
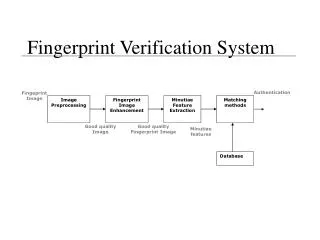
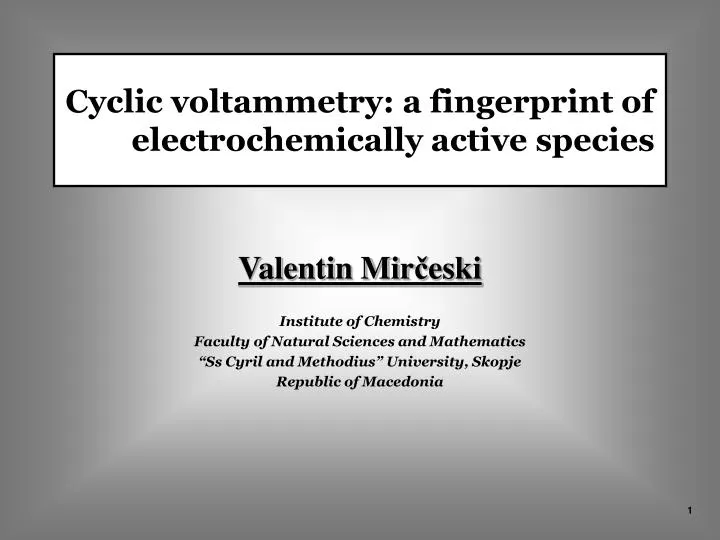
Cyclic voltammetry: a fingerprint of electrochemically active species. Valentin Mir č eski Institute of Chemistry Faculty of Natural Sciences and Mathematics “Ss Cyril and Methodius” University, Skopje Republic of Macedonia. R O + e. Red Ox + e. Ox + e Red. E / V. Current / A.

E N D
Cyclic voltammetry: a fingerprint of electrochemically active species Valentin Mirčeski Institute of Chemistry Faculty of Natural Sciences and Mathematics “Ss Cyril and Methodius” University, Skopje Republic of Macedonia
R O + e Red Ox + e Ox + e Red E / V Current / A t / s O + e R Potential / V Cyclic Voltammetry – a potentiodinamic transient voltammetry forward scan reverse scan Variation of the electrode potential in the course of the experiment. The rate of potential variation in time is called scan rate (v (V/s)), which represents the critical time of the experiment. R ⇄O + e- Cyclic voltammetry (CV) is the most frequently used technique. Almost any electrochemical study starts with application of CV. From the features of the cyclic voltammogram, one can deduce thermodynamic, kinetic and mechanistic characteristics of the electrode reaction! The outcome of the experiment is presented as an I-E curve, called cyclic voltammogram. By convention, the positive current reflects oxidation, whereas the negative current represents reduction reaction.
Typical features of a cyclic voltammogram • Anodic peak current • Cathodic peak current • Anodic peak potential • Cathodic peak potential Ip,a (anod. peak current) Ep,a (anod. peak potential) The peak-like shape of the voltammetric curves of both forward and reverse scan are consequence of the exhaustion of the diffusion layer adjacent to the electrode with the electroactive material. With time, the thickness of the diffusion layer increases, thus the flux (i.e., the current) decreases with time. That is why the current commences decreasing after reaching the peak of the current. The expansion of the diffusion layer with time is shown on a next slide. Current / A Ip,c (cathod. peak current) Ep,c (cathod. peak potential) Potential / V
t = 0 1 t = 0,1 s t = 0,01 s t = 0,001 s cR / c*R t = 1 s 0,2 x Concentration profiles of a Cottrell experiment (explanation of the previous slide) The thickness of the diffusion layer increases with time! Concentration profiles. Variation of the concentration of electroactive species with the distance x measured from the electrode surface at different times of the chronoamperometric experiment.
Electrode mechanism revealed by cyclic voltammetry: Reversible electrode reaction Reversible electrode reaction of R (R = O + ne) species dissolved in the electrolyte solution undergoing oxidation at the electrode surface means that the voltammogram is affected by the mass transfer regime only, and the redox species at the electrode surface obey the Nernst equation: E = E0 +RT/nF ln (cO/cR). The peak current Ip,a= (2,69 105) n3/2AcD1/2v1/2 Randles-Sevcik equation n – number of electrons in the electrode reaction A – electrode surface area c – concentration of redox active species dissolved in the electrolyte solution D – diffusion coefficient of the redox active species v – scan rate (the speed of variation of the potential with time Emid Current / A • The ratio of the peak currents is equal to 1; Ip,c/Ip,a = 1 and it is independent on the scan rate. • Ep,a – Ep,c = RT/nF ( 59 mV/n) • The peak potentials are independent on the scan rate • The mid-peak potential (Emid = (Ep,a – Ep,c)/2 is equal to the formal (standard) potential E0 of the redox couple R/O Potential / V
1,2 0.400 Ip,a/Ip,c = 0.095 0.019 Ep,a – Ep,c = 0.057 V 1 0,8 0.300 Ip,a/ mA 0,6 0,4 0.200 0,2 0 0.100 0 5 10 15 20 I / mA 1/2 v / (mV/s) 0 -0.100 -0.100 0 0.100 0.200 0.300 0.400 0.500 0.600 0.700 E / V Cyclic voltammograms of ferrocenedimethanol: reversible electrode reaction Ip= const. v1/2
Totally irreversible electrode reaction R O + ne- electrochemically irreversible electrode reaction reversible electrode reaction The plot compares CV of a reversible (blue) with a very slow (irreversible) electrode reaction. For a very slow irreversible electrode reaction, the peak potential and current of the forward scan are deffined with the eqs below. In some cases, the reverse peak cannot be even observed, and the voltammogram of a irreversible electrode reaction contains only one CV peak. k0 is the standard rate constant and a is the electron transfer coefficient.
Quasireversible electrode reaction Quasireversible electrode reaction is controlled by both mass transfer regime and the kinetics of the electrode reaction. The critical parameter that controls voltammetric characteristics, is defined as k = к/( D)1/2, where = nFv/RT . Hence, the dimensionless kinetic parameter k unifies the diffusion coefficient (D) as a parameter representing the mass transfer, the standard rate constant (к), as a parameter controlling the rate of the electrode reaction, and the scan rate (v), as a parameter controlling the time available for the electrode reaction. The rate decreases The rate decreases Dimensionless cyclic voltammograms, obtained by the simulation of the experiment. The dimensionless current function Y is defined as Y = I (nFA)-1(D)-1/2. The plot displays a comparison of the dimensionless current function Y for electrode reactions characterized with different rate.
Dimensionless current function vs. real current In cyclic voltammetry, the current of any electrode mechanism can be defined as I = (nFA) (v)1/2(nF/RT)1/2D1/2Y The product(nFA) (v)1/2(nF/RT)1/2D1/2 contains only constants for given electrode reaction and experimental conditions, and it could be considered as amperometric constant kamp. Hence, I = kampY The function Y, could be reviled by simulations (mathematical modeling) only. It is specific for each electrode mechanism. Usually, it is a function of many other parameters, as electrode potential, rate constants, electron transfer coefficient, diffusion coefficients etc.: Y = f(E, k0, a, D…) Care must be taken in reading the literature in regard whether particular discussion refers to the properties of the real current I, or to the dimensionless current function Y, or to both. For instance, for a quasireversible electrode reaction, the dimensionless current function Y decreases by increasing the scan rate, however, the real current increases with the scan rate, as the scan rate affects both kamp and Y. Obviously, the effect of the scan rate on the kamp prevails compared to the simultaneous effect of the scan rate to Y. This is illustrated on the next slide.
Dimensionless vs. real cyclic voltammograms: variation of the scan rate scan rate increases scan rate increases Dimensionless current function Real current scan rate increase scan rate increase Cyclic voltammograms obtained by the simulation of the experiment at a planar electode of a dissolved redox couple. The dimensionless current function Y is defined as Y = I (nFA)-1(D)-1/2.
Decamethylferrocene: Quasireversible electrode reaction Variation of the electrode kinetic parameter k = к/(D)1/2 by altering the scan rate of the experiment. Increasing the scan rate, the parameter k decreases. As a consequence, the peak potential separation increases, indicating a quasirevrsible electrode reaction. Let us recall that for a reversible electrode reaction the peak potential separation should be independent on the scan rate. scan rate increase scan rate increase
Revealing complex electrode mechanisms: electrochemistry of cyclic hydroxylamine 1-hydroxy-3-methoxycarbonyl-2,2,5,5-tetramethylpyrrolidine (CMH): redox probe used for detection of superoxide formation in living cells. quasireversible electrode reaction reversible electrode reaction
pH-dependency of CMH voltammetry pH 4.2 v = 100 mV/s 0.025 pH 5.1 pH 6.2 0.020 pH 7 pH 7.8 0.015 pH 9 pH 9.8 0.000010 pH 11 pH 12 0.000005 pH 4 ~ 12 0.000000 -0.000005 -0.000010 -0.000015 -1.0 -0.5 0.0 0.5 1.0 1.5
Consecutive electron transfer: EE mechanism R R R - -H+ - -e -e +H+ - +e - +e N + N N N · OH – O O O CMH CM- CMox CM.
Electrode reaction coupled with a following irreversible chemical reaction - EC mechanism Cyclic voltammetryu is an excellent method for studying chemical reactions coupled with the electrode reaction. If the chemical reaction follows the electrode reaction, then the mechanism is termed as an EC mechanism, where the symbol E refers to the electrode reaction, while the symbol C refers to the follow up chemical reaction. In the scheme above, initially, in the solution, R species are present only. At the electrode surface, the reversible electrode reaction R = O +ne- is taking place. However, the product of the electrode reaction. i.e., the O species, are additionally involved in the chemical reaction leading to the electrochemically inactive final product P. The latter chemical reaction is attributed with a rate constant k. The latter chemical reaction takes place only in the vicinity of the electrode surface, i.e., in the thin diffusion layer close to the electrode in which O species are present due to previous electrode reaction. As O species are lost in the chemical reaction, in the reverse scan of the cyclic voltammogram, the reverse current is diminishing proportional to the rate of the chemical reaction. The shape of the cyclic voltammograms depends on the kinetic parameter kchem = k/ , which unifies the rate of the chemical reaction (k) and the available time of the voltammetric experiment represented by the scan rate = nFv/RT k R ⇄ ne- + O P
Typical voltammetric response of an EC mechanism observed for different values of the ratio kchem = k/ . When kchem is big value (kchem = 500), the rate of the follow-up chemical reaction is big, almost the complete amount of O species are consumed in the chemical reaction, thus, in the reverse scan of the cyclic voltammogram, no reduction current could be seen, as no O species remained to be reduced back to R species. When the chemical parameter is moderate (e.g., kchem = 0.01), the reverse scan is still formed, as significant fraction of O species are still present in the diffusion layer as the follow-up chemical reaction is significantly slow. Obviously, for given k, the parameter kchem could be made big or small depending on the scan rate of the experiment (i.e., the available time for the chemical reaction), which is an excellent tool for studying and estimating the kinetics of the chemical reaction. kchem =
EC mechanism of dopamine: predicting the evolution of the consecutive cyclic voltammograms • Dopamine/dopamine o-quinone is a reversible redox couple; • Dopamine o- quinone is chemically unstable and undergoes intra-molecular reorganization to leucochrome; • Leucochore is also electroactive compund. It can be oxidized at less positive potentials than dopamine;
⇆ 1 2 + 2H+ + 2e + 2H+ + 2e 2 ⇆ -5 0.125x10 1 -5 0.075x10 I / A -5 0.025x10 -5 -0.025x10 -5 -0.075x10 -0.100 0 0.100 0.200 0.300 0.400 0.500 0.600 0.700 E vs Ag/AgCl (3 M KCl) / V Electrochemical mechanism preceded by a chemical reaction: and CE mechanism. Redox chemistry of 2-palmitoylhydroquinone – an artificial cellular membrane calcium transporter 2 1
-4 0.150x10 -5 0.200x10 -4 0.100x10 -4 0.050x10 -5 0.100x10 0 0 I / A i / A -4 -0.050x10 -5 -4 -0.100x10 -0.100x10 -4 -0.150x10 -5 -0.200x10 -4 -0.200x10 -5 -0.300x10 -4 -0.250x10 -0.300 -0.050 0.200 0.450 0.700 -0.300 -0.050 0.200 0.450 0.700 E / V E / V -6 0.500x10 -6 0.400x10 -6 0.300x10 -6 0.200x10 -6 0.100x10 i / A 0 -6 -0.100x10 -6 -0.200x10 -6 -0.300x10 -6 -0.400x10 -6 -0.500x10 -0.300 -0.050 0.200 0.450 0.700 E / V Revealing the mechanism by varying the scan rate v = 10 mV s-1 v = 50 mV s-1 v = 100 mV s-1 0.007 0.005 0.0025 0 I/mA -0.0025 -0.005 -0.0075 -0.010 -0.300 -0.050 0.200 0.450 0.700 E / V v = 1 mV s-1
Voltammetry of an a surface confined redox couple: Reversible electrode reaction Reversible electrode reaction of a thin film: This is typical, idealized response of a reversible electrode reaction of a thin film immobilized on the electrode surface. The shape of the voltammogram dislikes strongly from the typical wave-shaped voltammogram of a dissolved redox couple. For a thin film, there is no mass transfer and the exhaustion of the redox active material in the course of the potential scan causes a peak like shape of voltammetric branches of the cyclic voltammogram.
The current of a reversible surface (thin-film) electrode reaction is defined as Here Go, and GR are surface concentration of O and R species, GT = Go + GR is the total surface concentration, E’ is the formal potential, andbo and bR are adsorption constants related with the Gibbs free energy of adsorption. Peak current is defined as: Peak potential is defined as: In addition, the following is valid: Ip,c = Ip,a, and Ep,c = Ep,a and the half-peak width is The charge consumed in a course of a single potential scan (calculated as a surface under the single voltammetric peak) is
Interactions between particles of the immobilized polymer on the electrode surface If there are interactions between immobilized species on the electrode surface, the shape of the voltammogram change as shown below. The interactions are quantified by the numerical interaction parameter a linked with the Frumkin adsorption isotherm. The values on the plot refer to the interaction parameter. When a = 0, there are no interactions. For a > 0 and a < 0, the interactions are attractive or repulsive between immobilized species on the electrode surface. Obviously the broadening and narrowing of the voltammetric peaks are linked to the repulsive and attractive interactions, respectively.
Guasireversible electrode reaction of a surface confined redox couple If the charge transfer within the film is slow, the redox equilibrium does not prevail, hence instead of having so called reversible electrochemical behaviour, the system behaves as a quasireversible electrode process. Thus, the rate of the charge transfer controls the voltammetric response, which is obviously seen from the shape of the voltammograms. The numbers on the plots correspond to the surface standard rate constant k0 (s-1). Thus, as the rate of the charge transport within the film is becoming slower, the separation between the cathodic and anodic CV peaks increases proportionally together with the decrease of the peak currents.