Download
1 / 9
90 likes | 180 Views
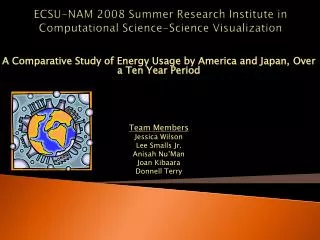
ECSU-NAM 2008 Summer Research Institute in Computational Science-Science Visualization. A Comparative Study of Energy Usage by American and Japan, Over the Last Ten Years Team Members Jessica Wilson Lee Smalls Jr. Anisah Nu’Man Joan Kibaara Donnell Terry. Abstract.

E N D
ECSU-NAM 2008 Summer Research Institute in Computational Science-Science Visualization A Comparative Study of Energy Usage by American and Japan, Over the Last Ten Years Team Members Jessica Wilson Lee Smalls Jr. AnisahNu’Man Joan Kibaara Donnell Terry
Abstract Energy is the vital force powering business, manufacturing and the transportation of goods and services to serve the American and world economies. The research is focused on energy used by USA and Japan. We will use existing data to do a comparison on how each of the two countries uses four different energy sources; oil, natural gases, coal and electricity. We will use the British Thermal Unit (BTU) to measure natural resource consumption. After compiling the data, we calculate the consumption for every 1000 people, for each country. In doing this we were able to see which country used the most energy regardless of population. We were then able to form the line of regression to give a visual comparison of energy usage between the US and Japan.