Download
1 / 64
640 likes | 738 Views
1981-2013 - The Aging HIV Epidemic New Strategies for a Changing Demographic. Overview. HIV Epidemiology Update HIV Medical Update HIV and Aging National HIV Strategy Minnesota’s HIV Services Minnesota Program HH Eligibility. History of HIV.

E N D
1981-2013 - The Aging HIV EpidemicNew Strategies for a Changing Demographic
Overview • HIV Epidemiology Update • HIV Medical Update • HIV and Aging • National HIV Strategy • Minnesota’s HIV Services • Minnesota Program HH Eligibility
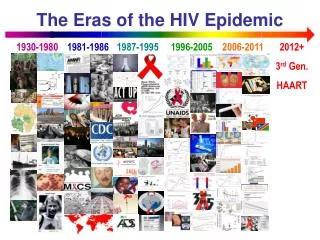
History of HIV • June, 1981, the Center for Disease Control reported clusters of an unusual illness • 1982- This illness was labeled AIDS • 1984- HIV was discovered • Initial medications were very expensive and highly toxic • 1996- The advent of highly active antiretroviral therapy
Why Are We Here? • Even with improvements to HIV care and treatment, HIV remains a significant public health threat • New infections on the rise • HIV is a chronic, lifelong condition • With more people living with HIV, the number of new infections is likely to continue to rise
National HIV Strategy • Reducing HIV incidence • Increasing access to care and optimizing health outcomes • Reducing HIV-related health disparities
National Perspective • The Center for Disease Control estimates 1.1 million people in the U.S. are living with HIV • 1 in 5 (18.1%) of those people are unaware of their infection • Over 50,000 Americans become infected with HIV each year • Nearly 636,000 people with AIDS have died in the U.S. since the epidemic began
National PerspectiveBy Sub-Populations • RISK GROUP • MSM • Although MSM represent 4% of the U.S. male population, MSM accounted for 78% of new HIV infections among males • From 2008-2010 there was a 12% increase in new infections among MSM • The number of new HIV infections was greatest among MSM in the youngest age group (13-24) • Young, black, MSM most severely burdened
National PerspectiveBy Sub-Populations • RISK GROUP • Heterosexuals • Accounted for 25% of estimated new HIV infections in 2010 • Injection Drug Users • Represented 8% of new HIV infections in 2010, and 16% of those living with HIV in 2009
National PerspectiveBy Sub-Populations • GENDER • Women • HIV infections among women are primarily attributed to heterosexual contact or injection drug use • Accounted for 20% of estimated new infections in 2010 and 20% of those living with HIV infection in 2008 • There was a 21% decrease from 2008-2010 • Men • Accounted for approximately 80% of those living with HIV infection in 2010
National PerspectiveBy Sub-Populations • RACE • Blacks continue to experience the most severe burden of HIV • Blacks represent approximately 12% of the U.S. population, but accounted for an estimated 44% of new infections in 2010. • Latinos are also disproportionately affected by HIV • Latinos represented 16% of the U.S. population, but accounted for 21% of new infections in 2009.
National PerspectiveBy Sub-Populations • YOUTH • Young people aged 13-24 accounted for 20% of all new HIV infections in the U.S. in 2009 • HIV disproportionately affects young gay and bisexual men and young African Americans • Among young black MSM, new HIV infections increased 48% from 2006-2009
Prevention Challenges for Youth • Sexual Risk Factors • Early age at sexual initiation • Unprotected sex • Older sex partners • Male-to-male sex • Sexual abuse • Sexually transmitted infections • Substance use • Lack of awareness
Younger Patients • Based on a U.S. government report released in August 2012 • The least likely to be receiving medical care and medications • 15% of those aged 25-34 had an undetectable viral load • Compared to • 36% of those aged 55-64 • Only 22% of young adults are taking HIV medications
Transmission and Treatment Rates • The same factors drive high transmission and poor treatment rates among U.S. groups that are disproportionately impacted • Poverty • Lack of access to medical care • Lack of education about what causes HIV and what people can do about it
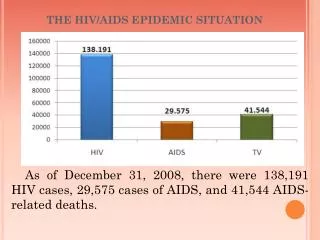
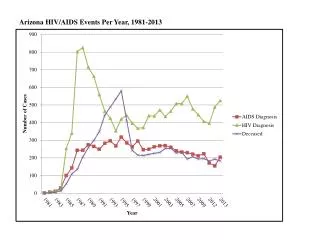
Minnesota HIV/AIDS Surveillance • As of December 31, 2012, a cumulative total of 10,112 persons have been diagnosed and reported with HIV infection in Minnesota. • Of these 10,112 persons, 3,459 are known to be deceased • As of December 31, 2012, 7,516 persons are assumed alive and living in Minnesota with HIV/AIDS • 3,974 living with HIV infection (non-AIDS) • 3,452 living with AIDS
HIV Infections† by County of Residence at Diagnosis, 2012 City of Minneapolis – 123 City of St. Paul – 44 Suburban# – 94 Greater Minnesota - 54 Number of Infections None 1-2 Total number = 315 3-5 6-14 15-53 54-180 *Counties in which a state correctional facility is located #7-county metro area, excluding the cities of Minneapolis and St. Paul †HIV or AIDS at first diagnosis
HIV Infections* in Minnesota by Residence at Diagnosis, 2012 Total Number = 315 Suburban = Seven-county metro area including Anoka, Carver, Dakota, Hennepin (except Minneapolis), Ramsey (except St. Paul), Scott, and Washington counties. Greater MN = All other Minnesota counties, outside the seven-county metro area. * HIV or AIDS at first diagnosis
Number Living with HIV/AIDS None 1-20 21-100 101-500 501-1000 1000-2000 2001-4190 Living HIV/AIDS Cases by County of Residence, 2012 City of Minneapolis – 2,943 City of St. Paul – 1,025 Suburban# – 2,393 Greater Minnesota – 1,111 Total number = 7,472 (44 people missing residence information) #7-county metro area, excluding the cities of Minneapolis and St. Paul
Persons Living with HIV/AIDS in Minnesota by Gender, 2012 5,771 (77%) 1,745 (23%)
Population† (n = 5,303,925) HIV Diagnoses (n = 315) HIV Infections* Diagnosed in Year 2012 and General Population in Minnesota by Race/Ethnicity * HIV or AIDS at first diagnosis † Population estimates based on 2010 U.S. Census data. n = Number of persons Amer Ind = American Indian Afr Amer = African American (Black, not African-born persons) Afr born = African-born (Black, African-born persons)
Number of Cases and Rates (per 100,000 persons) of HIV Infection* by Race/Ethnicity† – Minnesota, 2012 * HIV or AIDS at first diagnosis; 2010 U.S. Census Data used for rate calculations. † “African-born” refers to Blacks who reported an African country of birth; “African American” refers to all other Blacks. †† Estimate of 72,930 Source: Retrieved from MNCompass.org on 3/22/12. Additional calculations by the State Demographic Center. ^ Other = Multi-racial persons or persons with unknown race
Average Age at HIV Diagnosis by Race/Ethnicity†:2010-2012 Cases with unknown or multiple race or unknown age were excluded. † “African-born” refers to Blacks who reported an African country of birth; “African American” refers to all other Blacks.
Persons Living with HIV/AIDS in Minnesotaby Age Group†, 2012 † Age missing for 8 people .
What is the difference between HIV and AIDS? • HIV versus an AIDS diagnosis • How long does this progression take? • What is the average life expectancy of someone with HIV?
Common Lab Counts • CD4 Count • A key measure of immune system health • Viral load • This test measures the amount of virus in the body • How do non-medical providers interpret these numbers?
Medications • AIDS drug cocktail vs. combination therapy • Adherence rates • Goal of medication • Medications as part of national HIV strategy • Health of individual • Public health approach • Medications and Aging • Drug resistance
HIV and Aging- Associated Diseases • Illnesses typically associated with aging that are elevated in persons with HIV and can occur at a younger age • Cardiovascular and lung disease • Kidney and liver disease • Bone loss, increased fracture risk and frailty • Cognitive impairment • Cancer • Arthritis • Diabetes and high blood pressure
Factors Associated with Accelerated Aging-Related Illnesses • Inflammation • Immune dysregulation • Polypharmacy • Long-term drug toxicities • Co-infections and comorbidities • Hepatitis B or C • Substance-use disorders • Stress, depression
What do HIV and Aging have in Common? • Inflammation • Weakening immune system • High levels of depression and isolation • Leads to skipping medication • Which aggravates other maladies
Transmission • What are the four fluids that transmit HIV? • Blood • Semen • Vaginal fluid • Breast milk • What are the most common ways HIV is transmitted today? • Unprotected anal, vaginal and oral sex • Sharing needles • From mother to child
Transmission Considerations for Older Adults • Aging of the sex organs • Lining of the vaginal and anal walls • Decrease in natural lubrication • The role of erectile dysfunction medications • Long term partner • New partners after epidemic began • Multiple partners, partner not monogamous • HIV education
Sex Among Older Adults With HIV • Some choose not to have sex at all • Fears about infecting others • Fears about exposure to STI’s • Shifting priorities • Disinterest in sex • Negative body image • Difficulty with sexual performance • Fear of rejection
Prevention • Universal precautions • Barrier methods • Syringe exchange and pharmacy access • Post-exposure prophylaxis • Pre-exposure prophylaxis
Prevention and Older Adults • Condom use • Only 18% of HIV negative and 58% of HIV positive sexually active men ages 49-80 said that “always” wear condoms. • Reasons for not using condoms • No need to worry about pregnancy • Loss of sensation and erectile dysfunction • Uncomfortable talking about safer sex • Sex under the influence of drugs and alcohol
Testing • How long does it take after an HIV exposure to receive a definitive HIV test result? • 3 months • Testing options • Rapid testing • Home test • Testing sites
Testing in Older Adults • HIV testing guidelines- informed consent • Annual blood draws • Role of health care provider • Sexual health history
Stigma • More than half of HIV positive people (50-65) practice “protective silence” • Not telling others to manage stigma • Social Stigmatization • Ageism and HIV-related stigma • Health care and social service providers • Infantilizing “elderspeak” • Violation of patient confidentiality • Exclusion of patient from provider/family discussion of patient care
Burden in Older Adults With HIV • Creating a new life after bracing for death • Changing community activism • Financial • Worries of growing older alone • Housing and senior centers
The Traditional Service System Medical Care Case Management Housing Financial Assistance Transportation Food Assistance Benefits Counseling Legal Social and Support Groups Employment