Download
1 / 13
130 likes | 267 Views
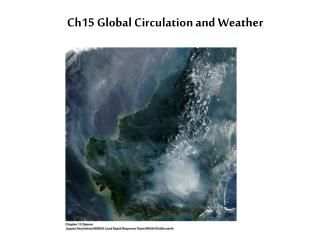
Natural Risks Assessment Laboratory. Storms activity : wave modelling and atmospheric circulation. Part 1. Wave modelling. V. Arkhipkin 1 , S. Myslenkov 1 Part 2. Atmospheric circulation. A. Kislov 1 , G. Surkova 1 1 Lomonosov Moscow State University 1. Part 1. Wave modelling. Task:

E N D
Natural Risks Assessment Laboratory Storms activity:wave modelling andatmospheric circulation Part 1. Wave modelling.V. Arkhipkin1, S. Myslenkov1 Part 2. Atmospheric circulation.A. Kislov1, G. Surkova1 1Lomonosov Moscow State University1
Part 1. Wave modelling. Task: High-resolution retrospective analysis of storm waves in the Russian coastal zones of the Black and Caspian Seas Working plan: 1. Detecting storm. In example it was high wind speed or high waves if data is available. 2. Using model BOM to compute general circulation for all Black Sea. 3. Using model SWAN to compute wave height for all Black Sea, with BOM data assimilation. 4. Wave model validation by using wave data from sensors or visual data5. Using SWAN or SMS for small sub area with high detailed grid to compute wave height and influence of refraction for particular part of coast zone, where risk is real.
Data and modeling tools Forcing wave model - NCEP-NCAR (~1,9x1,9; 4-daily) T,S climate data for thermohaline circulation Bathymetry BOM (Bergen Ocean Model) three-dimensional hydrodynamic multi-purpose model for coastal and shelf seas. SWAN (Simulating waves nearshore) is the most widely used computer model to compute irregular waves in coastal environments, based on deep water wave conditions, wind, bottom topography, currents and tides (deep and shallow water). SMS (Surface Water Modeling System) is a comprehensive environment for one-, two, and three-dimensional hydrodynamic modeling. A pre- and post-processor for surface water modeling and design, SMS includes 2D finite element, 2D finite difference, 3D finite element modeling tools.
Black Sea. Grid 5x5 km. Bathymetry and monthly climate Temprature, Salinity. BOM and SWAN adapted.
Model surface velocity (BOM) for climate T,S February. (Cm/s)
Caspian Sea. Grid 5x5 km. Bathymetry and monthly Climate Temperature, Salinity.BOM and SWAN are already adapted.
Model surface velocity for climate T,S August and February. (Cm/s) August February
Ship’s wave data Wave model validation by using visual wave data. Storm February 1953.
~4 km Nonstructural grid SMS for Blue Bay Black Sea.
Initial results: • BOM and Swan models adapted and validated for Black and Caspian Seas on 5x5 km grid. • Swan and SMS models adapted for Several small key regions on nonstructural grid ~ 5-50 m • Wave data base include 40 years 3-hours wave characteristics for Caspian Sea and 10 years for Black Sea (5x5 km grid).