Download
1 / 22
220 likes | 225 Views
Kentucky ’ s New Assessment and Accountability System. What to Expect for the First Release of Data. What does Kentucky ’ s new Assessment and Accountability System Look Like?. Achievement. Gap. OVERALL CATEGORY. Distinguished 90th Percentile & higher Proficient

E N D
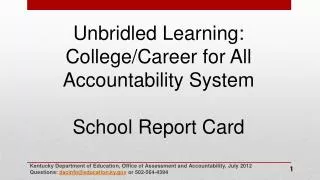
Kentucky’s New Assessment and Accountability System What to Expect for the First Release of Data
What does Kentucky’s new Assessment and Accountability System Look Like? Achievement Gap OVERALL CATEGORY Distinguished 90th Percentile & higher Proficient 70th - 89th Percentile Needs Improvement Below 70th Percentile Overall Score Percentile Rank Growth College/Career Readiness Graduation Rate
What tests do students take? • K-PREP – grades 3 through 8; reading, math, science, social studies and writing; also writing in grades 10 and 11 • ACT – grade 11 • EXPLORE – grade 8 • PLAN – grade 10 • End-of-Course Exams – high school; English, U.S. History, Algebra, Biology • Advanced Placement Exams – high school • NAEP Assessments – 4th and 8th grades
Labels Applied to Schools • Distinguished • Proficient • Needs Improvement
Other Labels Applied to Schools • Schools of Distinction • High-Performing Schools • High-Progress Schools • Priority Schools • Focus Schools
Tools to Help Schools Meet Accountability A set of aspirational Delivery Targets for: Achievement, Gap, College/Career Readiness and Graduation Rate Targets will help schools stay on track to improve overall scores and meet AMOs. Reported publicly.
8 69.0 13.8 25 5 50.5 10.1 64 12.8 81 16.2 57.9 Weighted Score comes from Achievement, Gap, Growth, College/Career Readiness and Graduation points multiplied by the weights in the chart. Weighted Score Summary comes from adding the weighted scores for each area.
Estimated Changes in Proficiency READING Percent Proficient or Higher Elem. Middle High MATHEMATICS Percent Proficient or Higher Elem. Middle High KCCT 2011 State Scores KCCT 2011 State Scores 76 73 70 65 65 Estimated Drop in Proficiency -37 -29 -10 Estimated Drop in Proficiency -36 -30 -25 46 40% met ACT CPE Reading Benchmark in 2011 36% met ACT CPE Mathematics Benchmark in 2011 Science and social studies data are based on the 2007 Kentucky Core Content for Assessment 4.1, therefore, distributions of proficiency will be similar to the 2011 profile.
11 71 Proficient 57.9 YES 57.9 3.0 60.9
How the AMO Is Calculated State Average for Elementary Schools: 50 Standard Deviation: 21 Elementary School A’s 2012 Overall Score: 29 Difference Between School A and State Average: 21 (one standard deviation) School A’s Required Improvement Over Five Years: 7 points (one-third of the standard deviation)
How Achievement Data Will Be Reported
How Growth Data Will Be Reported
How College/Career Readiness Data Will Be Reported • Number of Graduates- Students with High School Diploma or Certificate of Attainment • Number College-Ready • Number Career-Ready Academic • Number Career-Ready Technical • Number Career-Ready Total • Non-Duplicated Total • Total number of graduates (high school diploma or certificate of attainment) College- and/or Career-Ready • Percentage of graduates (high school diploma or certificate of attainment) College- and/or Career-Ready • Accountability Points with Bonus
How Graduation Rate Data Will Be Reported
What Does It All Mean? • Senate Bill 1, passed in 2009, required new standards for core subjects. Standards are the basis for content that is taught in subjects like reading and mathematics. • Kentucky and other states developed common standards for reading and math, so there would be consistency nationwide.
What Does It All Mean? • Kentucky’s focus is college and career readiness for all students. • The new standards will help teachers prepare students for a changing world and connect education with the economy and employment.
What Does It All Mean? • They will help principals with leadership, planning and making decisions that are best for students. • The new Kentucky Performance Rating for Educational Progress (K-PREP) tests are connected to the new, tougher standards.
What Does It All Mean? • K-PREP replaces the Kentucky Core Content Tests, which were given under the old CATS system. • The tests are more challenging and are directly tied to college/career readiness. • Students will experience more rigorous curriculum, instruction and tests.
Kentucky’s New Assessment and Accountability System What to Expect for the First Release of Data Questions? Send them to lisa.gross@education.ky.gov.