Download
1 / 22
220 likes | 331 Views
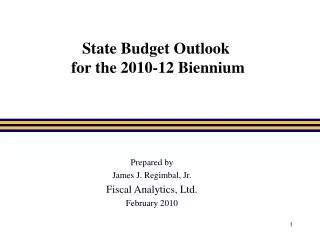
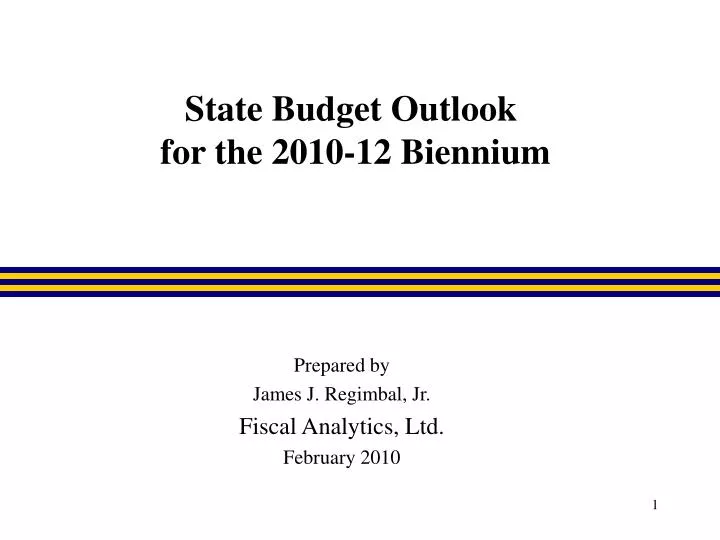
State Budget Outlook for the 2010-12 Biennium. Prepared by James J. Regimbal, Jr. Fiscal Analytics, Ltd. February 2010. -9.2%. SFC Forecast. -2.7%. Reduced State GF Forecast Still Contingent on Second Half Job Growth.

E N D
State Budget Outlook for the 2010-12 Biennium • Prepared by • James J. Regimbal, Jr. • Fiscal Analytics, Ltd. • February 2010
-9.2% SFC Forecast -2.7%
Reduced State GF Forecast Still Contingent on Second Half Job Growth
Significant Additional General Funds Are Necessary to Maintain Current Services When Federal Stimulus Ends *Federal ARRA stimulus funds used by Virginia to offset general fund cuts ** DMAS forecast presented to Senate Finance Committee 10/22/09 Note: Section 1739 of H.R. 3692 (The Affordable Health Care for America Act) extended FMAP increase for 2 quarters
* DMAS forecasted - does not include Medicaid expenditures for MH&MR facilities and CSA = $361mil. in FY 2008
Virginia Already Spends Significantly Less on Medicaid Than Other States Source: Kaiser Family Foundation, State Health Facts.Org
Introduced Budget Cut Anticipated 2010-12 Medicaid Spending by $419 mil. • Reduced provider reimbursements and eliminated inflation increases ($229 mil.). • Reduced Medicaid eligibility ($82 mil.). • Eliminated services and implemented a provider assessment to generate additional federal funding ($70 mil.) • General Fund Medicaid Reductions Also Lose the Additional 50% Federal Match.
Education Funding is Greatest Local Concern • Commonwealth has already reduced FY10 K-12 general funds by $1.2 billion -- partially offset by $568 mil. in federal stimulus and other non-general funding. • Expect additional K-12 cuts in 2010-12. Spending is about 79 percent salaries and benefits. • - K-12 is 34 percent of GF and 71 percent of local aid. • - A proportional cut to $950 mil. budget shortfall would be $300 mil./yr. • Localities already holding public education system together to meet SOA and SOL standards by spending $3 billion or 82% more per yearthan required to match state $. Local excess is 22 percent of total K-12 spending in state. • Introduced budget endorsed last year’s decision to reduce state support position funding by one-third ($376 mil. in FY 11). • Additional introduced 2010-12 K-12 Policy Changes • - Reduce health care premium support based on participation - $134.2 mil/yr • - Eliminate leave policy and other miscellaneous costs from SOQ - $86 mil/yr • - Eliminate nonpersonal cost inflation adjustment • - Eliminate VPSA technology grant program - $59 mil./yr • - Delay new Local Composite Index ($29 mil.)
Filling the Car Tax “Hole” Makes It Likely State K-12 Funding Will be Reduced Further • There are seven key components to the SOQ funding formula: • - Number of students • - Staffing ratios for teachers and other funded positions • - Salaries of teachers and other funded positions • - Fringe benefit rates • - Standard and prevailing support costs • - Inflation factors • - Prevailing federal revenues related to support costs • Approximately 79 percent of SOQ funding is for salaries and benefits
“Standards of Quality” Already Push Localities to Pay $3 Bil. More for Education Than Required • State does not pay for all Board of Education approved standards. • The state methodology (LWA) overemphasizes the generally lower values in the more numerous/smaller school divisions in calculating prevailing costs for teacher and support positions. • FY ‘08 base year for 2010-12 re-benchmarking does not reflect real-time salary costs: No state teacher compensation supplements since FY 2008. • Most localities go beyond state mandates, especially for at-risk student funding, including lowering class sizes to help meet SOL and SOA requirements.
Likely Examples of School Division Budget Reductions • Larger class sizes with fewer teachers. • Administrative, security, and technical support staff reductions. • Other pay and benefit reductions for remaining employees. • Reductions in summer school, pre-school and tutoring programs. • Reducing and charging for sports and other extra-curricular programs. • Fewer special education, alternative ed. and other specialty programs (e.g.,gifted and AP offering reductions). • Elimination of teacher training programs. • Increase in “no transportation” zones and policies.
* APA Comparative Report FY 1990 to FY 2008; VML/VACO survey results extrapolated for FY 2009 and FY 2010
General Fund Tax Changes Over Last 10 Yrs Have Neutralized 2004 Tax Increase
New Debt Capacity Is Limited…If Virginia Wants to Keep its AAA Rating 5% Debt Advisory Capacity Limit Source: Debt Capacity Advisory Committee, Dec. 19, 2009 http://www.trs.virginia.gov/Documents/Debt/DCAC/DCAC2009.pdf
Expect Wide Ranging Actions to Close Remaining $2 Bil. State Budget Shortfall • All options are on the table, including: • Further state agency consolidations and employee layoffs. • Increase the unfunded liability of VRS by reducing state contributions. • Further employee pay and benefit reductions (including increases in employee contributions to VRS and health insurance). • Additional cuts to public education and other aid for locally-delivered services. • Additional cuts to health & human service aid to individuals. • Find additional one-time revenues, including more debt, asset sales, and privatization initiatives. • Shift service costs to localities and health providers, raise college tuition, and increase service fees and transportation tolls. • Hope for additional federal assistance.
Major Policy Changes Proposed for 2010 - 2015 Six-Year VDOT Program • $5.5 billion in reductions since the spring of 2008. • Construction blueprint now primarily a federal match program that eliminates state formula distributions for unpaved roads, primary, secondary and urban systems. • Surface Transportation Program federal formula funding will no longer be distributed by locality in FY 11: CTB to do the programming. • If all federal funds are to be matched, adequate maintenance funding particularly for secondary roads no longer available. • First $492 mil. tranche of $3.18 bil. in authorized HB 3202 (2007) debt delayed from summer 2007 until summer 2010 due to insufficient insurance premiums – current FRAN debt has first call. Now expected to take until 2028 to let full HB 3202 authority. • - Over last 10 years, debt service has increased from 3% to 7% of total transportation expenditures.