Download
1 / 9
110 likes | 137 Views
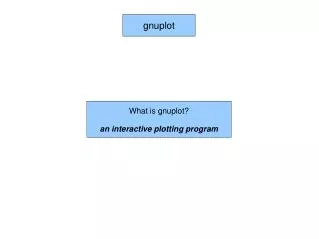
Basic Usage of GnuPlot. Hyun Hee Shim Department of Physics Kangwon National University. What is GnuPlot?. Introduction. GnuPlot is a command-driven interactive function plotting program. Operation.

E N D
Basic Usage of GnuPlot Hyun Hee Shim Department of Physics Kangwon National University
What is GnuPlot? • Introduction GnuPlot is a command-driven interactive function plotting program. • Operation • Plotting of two dimensional functions and data points in many • different style. • Plotting of three dimensional data points and surfaces in many • different style.
Starting and Quitting the GnuPlot Basic screen of GnuPlot • Starting : To start the GunPlot under Unix , just type the command • “gnuplot”. • Quitting : To exit GnuPlot, you can type either quit, exit or • simply q.
Menubar in the Gnuplot On the menu bar, you can use the source wish to select. File Plot Expressions
General Axis 3D Style Chart Function
Plotting function To start exploring GnuPlot, try the following command. • Plot Function : The first plot command produces a plot of function. In the first example, the range of x is not specified, so GnuPlot use its default range of (-10,10). Ex) plot cos(x)
Plot interval function The second plot command produces a plot of the functions sin and cos on the same graph, with x in the range (-π, π). In the second example, the phrase [-pi:pi] following plot tells GnuPlot to produce the plot with x in the range This tells GnuPlot to plot both functions on the same plot. Ex) plot [-pi : pi] sin(x**2),cos(exp(x))
Plotting the data gnuplot> plot “map.dat” u 1:2 t “” w p 3 Explanation : Point style using 3 color is pressed w p 3. : File for map.dat plot using data. : First column equal to x,second column equal to y. (u 1:2) Represented data
GnuPlot is function plotting program using the command. Summary • GnuPlot can plot data.