Download
1 / 38
380 likes | 483 Views
The AIDS Pandemic: an Update on the Numbers and Needs. What are the numbers for 2002? What are the global and regional trends? Where do all these numbers come from? How are the estimates made? Can we look into the future?. What are the numbers for 2002?.

E N D
The AIDS Pandemic: an Update on the Numbers and Needs • What are the numbers for 2002? • What are the global and regional trends? • Where do all these numbers come from? • How are the estimates made? • Can we look into the future?
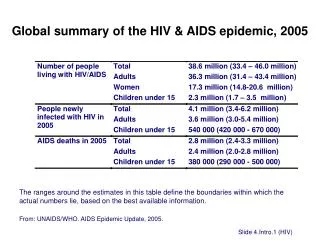
Global estimates foradults and childrenend 2002 • People living with HIV/AIDS • New HIV infections in 2002 • Deaths due to HIV/AIDS in 2002 42 million 5 million 3.1 million
Adults and children estimated to be living with HIV/AIDS as of end 2002 Eastern Europe & Central Asia 1.2 million Western Europe 570 000 North America 980 000 East Asia & Pacific 1.2 million North Africa & Middle East 550 000 South & South-East Asia 6 million Caribbean 440 000 Sub-Saharan Africa 29.4 million Latin America 1.5 million Australia & New Zealand 15 000 Total: 42 million (3.2 mln children)
Global Distribution of 42 million People Living with HIV in 2002
HIV Prevalence (% of adults 15-49) by Sex and Region in 2002
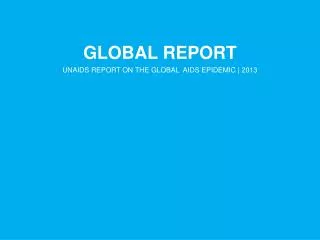
Estimated number of adults and childrennewly infected with HIV during 2002 Eastern Europe & Central Asia 250 000 Western Europe 30 000 North America 45 000 East Asia & Pacific 270 000 North Africa & Middle East 83 000 South & South-East Asia 700 000 Caribbean 60 000 Sub-Saharan Africa 3.5 million Latin America 150 000 Australia & New Zealand 500 Total: 5 million(0.8 mln children)
Global Distribution of 5 million Newly HIV Infected People in 2002
The Global Distribution of Prevalence (Old +New) is still very similar to the Global Distribution of Incidence (New) Prevalence Incidence
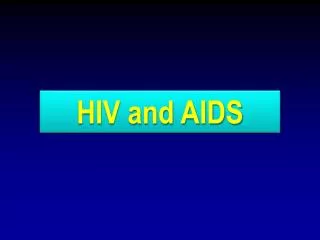
Estimated adult and child deathsfrom HIV/AIDS during 2002 Eastern Europe & Central Asia 25 000 Western Europe 8 000 North America 15 000 East Asia & Pacific 45 000 North Africa & Middle East 37 000 South & South-East Asia 440 000 Caribbean 42 000 Sub-Saharan Africa 2.4 million Latin America 60 000 Australia & New Zealand <100 Total: 3.1 million
Global Distribution of 3.1 million Adult and Child Deaths from HIV/AIDS in 2002
About 14 000 new HIV infections a day in 2002 • More than 95% are in developing countries (70% are in Africa) • 2000 are in children under 15 years of age (9 out of 10 are in Africa) • About 12 000 are in persons aged 15 to 49 years, of whom: • almost 50% are women • about 50% are 15–24 year olds
Comparing 2001 and 2002 • Modest increase in people living with HIV from 40 to 42 million, new infections still about 5 million, deaths about 3 million • 0.9 mln increase in Africa, • 0.8 mln South, Southeast, East Asia • 0.2 mln Eastern Europe and Central Asia
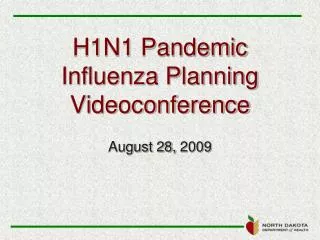
Trends in Number of People Living with HIV infection 1980 - 2002 by WHO Region
Trends in Number of People Living with HIV infection 1980 - 2002 by WHO Region
Trends in Number of People Living with HIV infection 1980 - 2002 by WHO Region
UNAIDS/WHO Classification of epidemic states • LOW LEVEL: • HIV prevalence has not consistently exceeded 5% in any defined sub-population (surveillance: high risk group focus) • CONCENTRATED • HIV prevalence consistently over 5% in at least one defined sub-population but below one percent in pregnant women in urban areas (surveillance: high risk groups + bridgers) • GENERALISED • HIV prevalence consistently over 1% in pregnant women nation-wide (surveillance: general population + high risk groups)
HIV Prevalence among Women Attending Antenatal Clinics, Uganda 1989-2001
HIV prevalence in blood donations in Indonesia: 1992 - 2001 0.016 0.014 0.012 0.010 Percentage HIV-positive 0.008 0.006 0.004 0.002 0.000 1992 – 1993 1993 – 1994 1994 – 1995 1995 – 1996 1996 – 1997 1997 – 1998 1998 – 1999 1999 – 2000 2000 – 2001 Source: National AIDS Programme, Indonesia
Source: Sentinel Serosurveillance, Division of Epidemiology, Ministry of Public Health. Remark: Switching from bi-annually (June and December) to annually in June since 1995 Conscript data in November of each year since 1995 were not shown here HIV Prevalence Among Pregnant Women, Male Conscripts, and Donated Blood Thailand 1989-2000 % Conscripts (age 21) Pregnant women Donated blood Month/Year
HIV prevalence among sex workers in selected provinces in China: 1993-2000 12 Guangxi Guangzhou Yunnan 9 % HIV-positive 6 3 0 1993 1994 1995 1996 1997 1998 1999 2000 Source: National AIDS Programme, China (1993-2000). Data compiled by the US Census Bureau
90 80 70 Myitkyina 60 Taunggyi 50 Percent (%) 40 30 20 10 0 94M 92M 99M 94S 95M 95S 96S 97M 98M 98S 99S 00M 92S 93S 96M 97S 93M 01m Sentinel Year HIV prevalence among injecting drug users in selected sentinel sites in Myanmar: Mar 1992 – Mar 2001 100 INDIA Myitkyina l CHINA l Taunggyi LAOS THAILAND Source: Myanmar National AIDS Programme
Epidemic model New entrants At risk (susceptible) Not at risk Non-AIDS death Non-AIDS death Infected Non-AIDS death AIDS deaths
Epidemic model New entrants fo At risk (susceptible) Not at risk r Non-AIDS death phi Non-AIDS death Infected Non-AIDS death AIDS deaths
Model epidemic curve f0 phi r t0
How bad can theAsian epidemic become? • Growth in size of Risk groups - • IDU, MSM,sex workers • Chances of mixing with general population - people’s movement, socio-political and economic developments • Response: behaviour change, vaccine, STD control etc.
Trends - Asia: Lessons Learned • Asian epidemics spread through specific, identifiable behaviors & populations • Asian epidemics are vulnerable to focused prevention efforts • Prevention in Asia produces huge benefits (Thailand averted over 5 million infections)
Global Prevention Focus: Young People(Percent of population aged 15-24 in 2000 and 2010)
Estimated Number of People Needing Treatment by 2005 Number depends on: - accuracy of the numbers of deaths projections - decisions on when to start treatment (clinical, lab) - how many people are already on treatment in preceding years - children Need 6-9 million by 2005
Global Goals: UNGASS and MDG • In terms of global numbers and needs the epidemic will be driven by Africa and Asia • UNGASS Target: 25% reduction globally by 2010 in prevalence among young people (15-24 years) (25% by 2005 in most severely affected countries) • MDG Target: turn around the epidemic by 2015