Download
1 / 11

E N D
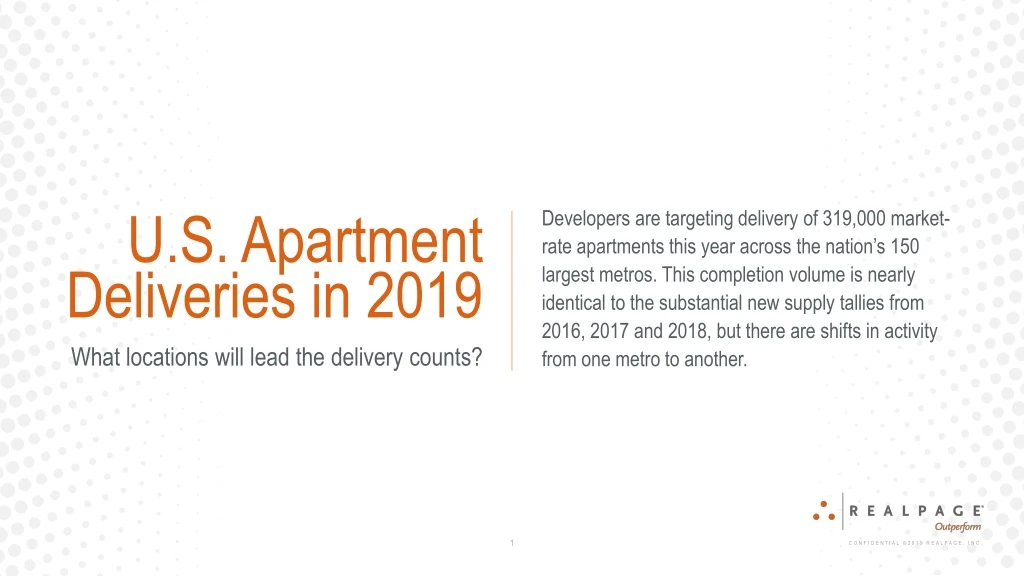
U.S. Apartment Deliveries in 2019 • Developers are targeting delivery of 319,000 market-rate apartments this year across the nation’s 150 largest metros. This completion volume is nearly identical to the substantial new supply tallies from 2016, 2017 and 2018, but there are shifts in activity from one metro to another. What locations will lead the delivery counts?
1. Dallas, TX • Dallas is the nation’s new supply leader for the current cycle, with about 116,000 units built since the beginning of 2010. Strong job growth has allowed all of these completions to be absorbed, but rent growth has faltered as deliveries have mounted of late, slowing to an annual pace of 2%.
2. Los Angeles, CA • In the biggest run-up in activity across the country’s building leaders, the Los Angeles apartment delivery count this year is targeted to double 2018’s volume. Key pockets of construction are in Downtown as well as the Wilshire Boulevard corridor, Hollywood and the Santa Monica/Marina del Rey area.
3. New York, NY • Notable construction is occurring across a variety of neighborhoods in Manhattan, Brooklyn and Queens. Plus, Westchester County is set to get its largest block of new supply in quite some time. Look for rent growth to remain spotty from one submarket to another, influenced by the flow of new supply.
4. Washington, DC • After apartment deliveries in metro Washington lulled a bit in 2018, completions will accelerate again in 2019. Activity tends to move around from one neighborhood to another in this market. Deliveries will spike this year in spots like the Navy Yard/Capitol South area and the northeast portion of the District.
5. Seattle, WA • Rents have already flattened in Seattle’s urban core neighborhoods, which will account for about 40% of 2019’s elevated new supply volume. Thus, look for a competitive leasing environment there. The short-term outlook is more promising for suburban construction hot spots like Redmond and the Kirkland-Bothell area.
6. Atlanta, GA • While the urban Midtown and Buckhead submarkets still account for the biggest blocks of apartments on the way, metro Atlanta’s upturn in total activity for the most part reflects a jump in building across key suburban locations. Spreading out the building appears likely to help near-term performance prospects.
7. Denver, CO • Whereas apartment construction is getting less focused on the urban core in some markets, the reverse is true in Denver. Downtown and surrounding neighborhoods account for nearly half the metro’s deliveries scheduled for 2019. Thus, some slowing of rent growth, solid to date, could emerge in that zone.
8. Newark-Jersey City, NJ • Northern New Jersey’s scheduled 2019 apartment completions form the biggest annual block of new supply seen so far in the current economic cycle. Jersey City and towns in the northern portion of Hudson County are the market’s building hot spots, but there’s at least a little activity in lots of other locations.
9. Chicago, IL • The focus of urban core deliveries in metro Chicago during 2019 will flip into The Loop submarket, whereas completions will cool in the adjacent Streeterville/River North area, last year’s building leader. In turn, look for a shift in rent growth momentum between the two submarkets that drive the overall performance.
#10. Phoenix, AZ • Phoenix’s scheduled deliveries in 2019 reach the highest levels seen so far in this cycle, returning to the all-time records established in the early 2000s. Some slowing in rent growth appears likely as the metro adjusts to so much product in lease-up, but that cooling will be from a current rate of more than 7%.