Download
1 / 1
10 likes | 71 Views
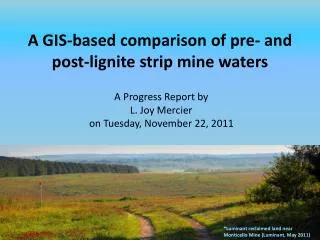
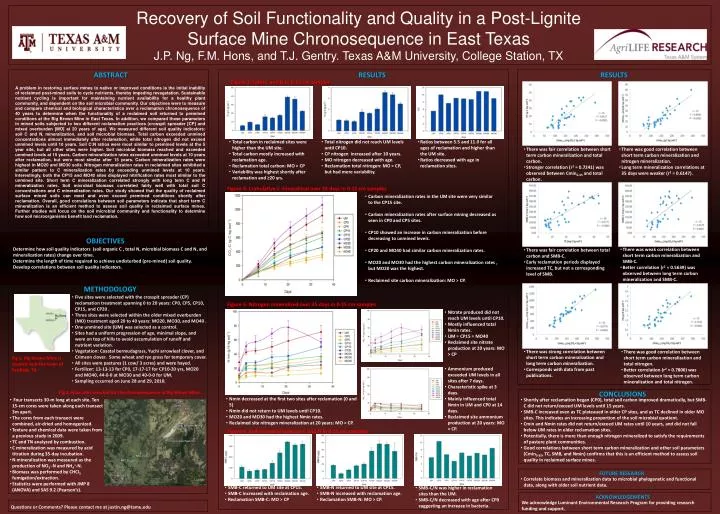
Recovery of Soil Functionality and Quality in a Post-Lignite Surface Mine Chronosequence in East Texas J.P. Ng, F.M. Hons, and T.J. Gentry. Texas A&M University, College Station, TX. ABSTRACT. RESULTS. RESULTS. Figure 3. Total C and N in 0-15 cm samples.

E N D
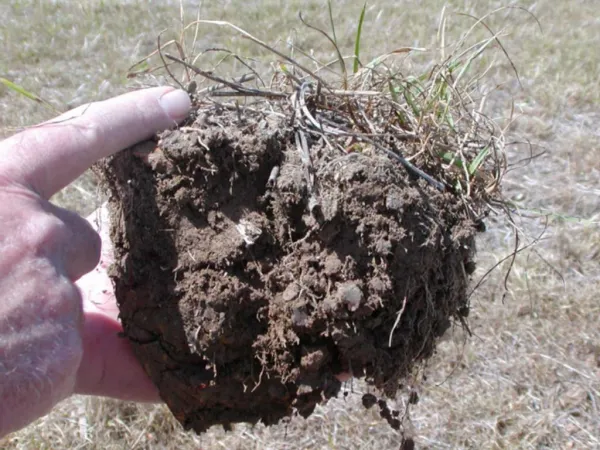
Recovery of Soil Functionality and Quality in a Post-Lignite Surface Mine Chronosequence in East Texas J.P. Ng, F.M. Hons, and T.J. Gentry. Texas A&M University, College Station, TX ABSTRACT RESULTS RESULTS Figure 3. Total C and N in 0-15 cm samples A problem in restoring surface mines to native or improved conditions is the initial inability of reclaimed post-mined soils to cycle nutrients, thereby impeding revegetation. Sustainable nutrient cycling is important for maintaining nutrient availability for a healthy plant community, and dependent on the soil microbial community. Our objectives were to measure and compare chemical and biological characteristics over a reclamation chronosequence of 40 years to determine when the functionality of a reclaimed soil returned to premined conditions at the Big Brown Mine in East Texas. In addition, we compared these parameters in mined soils subjected to two different reclamation practices (crosspit spreader [CP] and mixed overburden [MO] at 20 years of age). We measured different soil quality indicators: soil C and N, mineralization, and soil microbial biomass. Total carbon exceeded unmined concentrations almost immediately after reclamation, while total nitrogen did not exceed unmined levels until 10 years. Soil C:N ratios were most similar to premined levels at the 5 year site, but all other sites were higher. Soil microbial biomass reached and exceeded unmined levels at 15 years. Carbon mineralization rates exceeded unmined levels at 10 years after reclamation, but were most similar after 15 years. Carbon mineralization rates were highest in MO20 and MO30 soils. Nitrogen mineralization rates in reclaimed sites exhibited a similar pattern to C mineralization rates by exceeding unmined levels at 10 years. Interestingly, both the CP15 and MO40 sites displayed nitrification rates most similar to the unmined site. Short term C mineralization correlated strongly with long term C and N mineralization rates. Soil microbial biomass correlated fairly well with total soil C concentrations and C mineralization rates. Our study showed that the quality of reclaimed surface mined soils can meet and even exceed premined conditions shortly after reclamation. Overall, good correlations between soil parameters indicate that short term C mineralization is an efficient method to assess soil quality in reclaimed surface mines. Further studies will focus on the soil microbial community and functionality to determine how soil microorganisms benefit land reclamation. • Total carbon in reclaimed sites were higher than the UM site. • Total carbon mostly increased with reclamation age. • Reclamation total carbon: MO > CP • Variability was highest shortly after reclamation and ≥20 yrs. • Total nitrogen did not reach UM levels until CP10. • CP nitrogen increased after 10 years. • MO nitrogen decreased with age. • Reclamation total nitrogen: MO > CP, but had more variability. • Ratios between 5.5 and 11.0 for all ages of reclamation and higher than the UM site. • Ratios decreased with age in reclamation sites. • There was fair correlation between short term carbon mineralization and total carbon. • Stronger correlation (r2 = 0.7241) was observed between Cmin0-35 and total carbon. • There was good correlation between short term carbon mineralization and nitrogen mineralization. • Long term mineralization correlations at 35 days were weaker (r2 = 0.6147). Figure 4. Cumulative C mineralized over 35 days in 0-15 cm samples • Carbon mineralization rates in the UM site were very similar to the CP15 site. • Carbon mineralization rates after surface mining decreased as seen in CP0 and CP5 sites. • CP10 showed an increase in carbon mineralization before decreasing to unmined levels. • CP20 and MO40 had similar carbon mineralization rates. • MO20 and MO30 had the highest carbon mineralization rates , but MO20 was the highest. • Reclaimed site carbon mineralization: MO > CP. OBJECTIVES Determine how soil quality indicators (soil organic C , total N, microbial biomass C and N, and mineralization rates) change over time. Determine the length of time required to achieve undisturbed (pre-mined) soil quality. Develop correlations between soil quality indicators. • There was weak correlation between short term carbon mineralization and SMB-C. • Better correlation (r2 = 0.5639) was observed between long term carbon mineralization and SMB-C. • There was fair correlation between total carbon and SMB-C. • Early reclamation periods displayed increased TC, but not a corresponding level of SMB. METHODOLOGY • Five sites were selected with the crosspit spreader (CP) reclamation treatment spanning 0 to 20 years: CP0, CP5, CP10, CP15, and CP20 . • Three sites were selected within the older mixed overburden (MO) treatment aged 20 to 40 years: MO20, MO30, and MO40 . • One unmined site (UM) was selected as a control. • Sites had a uniform progression of age, minimal slope, and were on top of hills to avoid accumulation of runoff and nutrient variation. • Vegetation: Coastal bermudagrass, Yuchiarrowleaf clover, and Crimson clover. Some wheat and rye grass for temporary cover. • All sites were pastures(1 cow/ 3 acres) and werehayed. • Fertilizer: 13-13-13 for CP0, 17-17-17 for CP10-20 yrs, MO20 and MO40, 44-0-0 at MO30 and 40-0-0 for UM. • Sampling occurred on June 28 and 29, 2010. Figure 5. Nitrogen mineralized over 35 days in 0-15 cm samples • Nitrate produced did not reach UM levels until CP10. • Mostly influenced total Nmin rates. • UM = CP15 = MO40 • Reclaimed site nitrate production at 20 years: MO > CP • There was strong correlation between short term carbon mineralization and long term carbon mineralization. • Corresponds with data from past publications. • There was good correlation between short term carbon mineralization and total nitrogen. • Better correlation (r2 = 0.7806) was observed between long term carbon mineralization and total nitrogen. Fig 1. Big Brown Mine is located near the town of Fairfield, TX. • Ammonium produced exceeded UM levels in all sites after 7 days. • Characteristic spike at 3 days. • Mainly influenced total Nmin in UM and CP0 at 14 days. • Reclaimed site ammonium production at 20 years: MO > CP. CONCLUSIONS Fig 2. Nine sites selected for the chronosequence at Big Brown Mine. • Nmin decreased at the first two sites after reclamation (0 and 5) • Nmin did not return to UM levels until CP10. • MO20 and MO30 had the highest Nmin rates. • Reclaimed site nitrogen mineralization at 20 years: MO > CP. • Four transects 30-m long at each site. Ten 15-cm cores were taken along each transect 3m apart. • The cores from each transect were combined, air-dried and homogenized. • Texture and chemical data were taken from a previous study in 2009. • TC and TN analyzed by combustion. • C mineralization was measured by acid titration during 35-day incubation. • N mineralization was measured as the production of NO3--N and NH4+-N. • Biomass was performed by CHCl3 fumigation/extraction. • Statistics were performed with JMP 8 (ANOVA) and SAS 9.2 (Pearson’s). • Shortly after reclamation began (CP0), total soil carbon improved dramatically, but SMB-C did not return/exceed UM levels until 15 years. • SMB-C increased even as TC plateaued in older CP sites, and as TC declined in older MO sites. This indicates an increasing proportion of the soil microbial quotient. • Cmin and Nmin rates did not return/exceed UM rates until 10 years, and did not fall below UM rates in older reclamation sites. • Potentially, there is more than enough nitrogen mineralized to satisfy the requirements of pasture plant communities. • Good correlations between short term carbon mineralization and other soil parameters (Cmin0-35, TC, SMB, and Nmin) confirms that this is an efficient method to assess soil quality in reclaimed surface mines. Figure 6. Soil microbial biomass C and N in 0-15 cm samples FUTURE RESEARCH • Correlate biomass and mineralization data to microbial phylogenetic and functional data, along with older soil nutrient data. • SMB-C returned to UM site at CP15. • SMB-C increased with reclamation age. • Reclamation SMB-C: MO > CP • SMB-N returned to UM site at CP15. • SMB-N increased with reclamation age. • Reclamation SMB-N: MO > CP. • SMB-C/N was higher in reclamation sites than the UM. • SMB-C/N decreased with age after CP0 suggesting an increase in bacteria. ACKNOWLEDGEMENTS We acknowledge Luminant Environmental Research Program for providing research funding and support. Questions or Comments? Please contact me at justin.ng@tamu.edu