Download
1 / 25
250 likes | 396 Views
Green Power Marketing and Policies to Support Wind Energy Development. Lori Bird Senior Energy Analyst National Renewable Energy Lab lori_bird@nrel.gov. NC Wind Summit December 9, 2002 Boone, North Carolina. Why Green Power?. Air quality/public health benefits

E N D
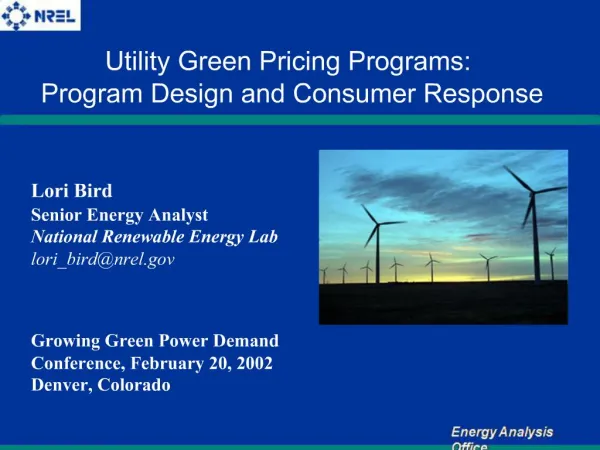
Green Power Marketing and Policies to Support Wind Energy Development Lori Bird Senior Energy Analyst National Renewable Energy Lab lori_bird@nrel.gov NC Wind Summit December 9, 2002 Boone, North Carolina
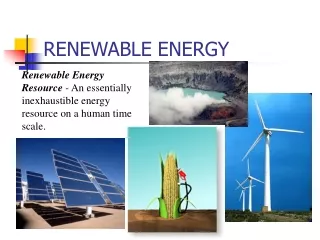
Why Green Power? • Air quality/public health benefits • Reduce greenhouse gas emissions • Price stability • National security, resource diversity • Support development of new technologies – energy for the future • Rural economic development
Market Research Findings • NREL “Willingness to Pay” Analyses • National surveys • 56% to 80% of Americans say they are willing to pay more for environmental protection or for renewable electricity. • Utility surveys • 52% to 95% of residential customers were willing to pay more for power from renewable sources. • Roper Green Gauge Report • 51% would be WTP 7.6% more for electricity generated from less polluting renewables • Utility Field Studies • With 100% awareness, green power demand could be 10% to 20% of households.
Markets for Green Power • Competitive markets – green marketing • Certificate-based products – only the renewable attributes are sold • Available to all customers • Customers do not have to switch suppliers • Regulated markets – green pricing
Green Power in Competitive Electricity Markets • In the Mid Atlantic: • universities and others are supporting development of 145 MW of new wind capacity • In the Pacific Northwest: • green power sales have tripled in last year • 350 MW of new wind supported in part by green mkting • In Texas: • 6% of customers who switched opted for green power
Emerging Market: Renewable Energy Certificates (RECs) • Green certificates represent the environmental attributes of renewable electricity. Can be sold separately from commodity electricity. • Other names: tradable renewable energy certificates (TRCs), green tags • A dozen companies market certificates: • Ex. Aquila, Bonneville Environmental Foundation, Community Energy, Renewable Choice Energy, Sterling Planet, Sun Power Electric • Being used to support both small-scale and large-scale renewable projects
Utility Green Pricing Programs • More than 200,000 customers participate in utility programs • Average participation rate of 1%, leading programs 3-7% • Marketing emphasis on residential customers • About 1/3 of sales are to non-residential customers • Median price premium 2.5¢/kWh • Average residential customer spends about $5.50/month ~500 million kWh sold annually
Key Elements of Successful Green Pricing Programs • Creating Value • Personal recognition • Visibility • Educational benefits • Price stability • Program Implementation • Minimize the premium • Offer power from new renewable resources • Simplicity in message and design • Tenacity in marketing • Strategic partnerships
Who is Buying Green Power? • Households • Small, medium, and large businesses • Business “chains” • Business organizations • Health organizations • Faith-based groups • Colleges and universities • State and municipal governments • Federal agencies
Non-Residential Green Power Purchases Increased interest on part of: • State and municipal government purchases • MD (initially 6%, increased to 20%) • NJ (12%) • NY (10% by 2005, 20% by 2010) • PA (5%) • Chicago + 48 local agencies (20% = 80 MW by 2005) • Seattle (5% = 175 MW by 2004) • Colleges and universities • 84 corporations have joined the Green Power Partnership, representing >530,000 MWh (60 aMW) per year.
Green Power Market Summary • Nearly 40% of U.S. customers have access to a green power product directly from a utility or supplier. • Also, about a dozen companies are actively marketing RECs. • About 650 MW installed to serve green power customers as of 2001 • Another 440 MW planned • 87% is supplied from wind • More than 400,000 customers purchase green power.
Policy Options • Mandatory purchase requirements/ Renewable portfolio standards • Renewable energy funds • Financial incentives • Net metering • Fuel source and environmental disclosure
MN: 550 MW by 2002 + 400 MW by 2012 ME: 30% by 2000 WI: 2.2% by 2011 MA: 4% by 2009 NV: 15% by 2013 CT: 13% by 2009 NJ: 6.5% by 2012 IA: ~250 MW by 1999 PA: varies by utility AZ: 1.1% by 2007, 60% solar NM: 5% of standard offer in 2007, as available TX: 2880 MW by 2009 (2000 MW new) RPS and Purchase Obligations • 12 states • 25% of retail load in US covered Source: Lawrence Berkeley National Laboratory Energy Analysis Office
State Renewable Energy Funds Cumulative 1998-2012 (million $) $10 mil. $94 mil. MA: $332 mil $95 mil. $32 mil. $85 mil. RI: $10 mil $80 mil. CT: $275 mil $20 mil. NJ: $271 mil. $127 mil DE: $11 mil. $1890 mil • 16 states with renewable funds • $3.6 billion collected through 2012 $40 mil. $234 mil. Source: Lawrence Berkeley National Laboratory
State Financial Incentives • Production tax credits (MD, MN, OK) • Investment tax credits (MD) • Property tax exemptions • Sales tax exemptions (FL, RI) • Excise tax exemption (SD) • Income tax credits (NY, RI) • Small system rebates (FL, CA)
Net Metering • What is it? • Customer-sited systems are credited at the retail rate for electricity generated. • Customer meter spins backward when system generates power in excess of demand. • Issues • Determine qualifying technologies and capacity limits (range from <10kw to <1,000 kW) • Determine treatment of net excess generation • Best practices • Monthly carryover with annual true-up • Interconnection issues addressed with standard contracts and uniform safety/insurance requirements
Fuel Mix and Environmental Disclosure Issues • More than 20 states require suppliers to disclose fuel mix and in some cases emissions • Includes some states with regulated electricity markets (e.g., Colorado, Florida) • Implementation issues • Information: Fuel sources, emissions and other environmental impacts; standard format, pie charts/tables • Scope: All utilities and competitive suppliers • Frequency: typically quarterly to annually • Distribution: via bill inserts, separate mailings, utility web sites, contracts, marketing materials • Verification: Audits, supporting documentation, official tracking system (e.g., Texas, New England)
The Green Power Network provides news and information on green power markets and utility green pricing programs. You will find links to green power providers and product offerings, and information on consumer and policy issues that impact the development of green power markets. http://www.eren.doe.gov/greenpower