Download
1 / 17
170 likes | 278 Views
Successes of Energy Efficiency: The United States and California National Environmental Trust May 2, 2007. Arthur H. Rosenfeld, Commissioner California Energy Commission (916) 654-4930 ARosenfe@Energy.State.CA.US http://www.energy.ca.gov/commission/commissioners/rosenfeld.html

E N D
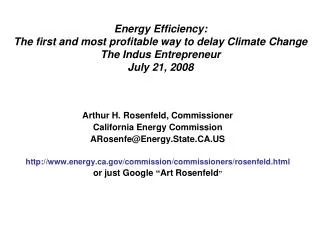
Successes of Energy Efficiency: The United States and CaliforniaNational Environmental TrustMay 2, 2007 Arthur H. Rosenfeld, Commissioner California Energy Commission (916) 654-4930 ARosenfe@Energy.State.CA.US http://www.energy.ca.gov/commission/commissioners/rosenfeld.html or just Google “Art Rosenfeld”
12% of GDP = $1.7 Trillion 7% of GDP = $1.0 Trillion
How Much of The Savings Come from Efficiency? • Easiest to tease out is cars • In the early 1970s, only 14 miles per gallons • Now about 21 miles per gallon • If still at 14 mpg, we’d consume 75 billion gallons more and pay $225 Billion more at 2006 prices • But we still pay $450 Billion per year • If California wins the “Schwarzenegger-Pavley” suit, and it is implemented nationwide, we’ll save another $150 Billion per year • Commercial Aviation improvements save another $50 Billion per year • Appliances and Buildings are more complex • We must sort out true efficiency gains vs. structural changes (from smokestack to service economy).
How Much of The Savings Come from Efficiency (cont’d)? • Some examples of estimated savings in 2006 based on 1974 efficiencies minus 2006 efficiencies • Beginning in 2007 in California, reduction of “vampire” or stand-by losses • This will save $10 Billion when finally implemented, nation-wide • Out of a total $700 Billion, a crude summary is that 1/3 is structural, 1/3 is from transportation, and 1/3 from buildings and industry.
Carbon Dioxide Intensity and Per Capita CO2 Emissions -- 2001 (Fossil Fuel Combustion Only) 25.00 United States 20.00 Netherlands Australia Canada 15.00 Belgium Tons of CO2 per person California Denmark Germany 10.00 Austria Japan New S. Korea Zealand Italy Switzerland France 5.00 Mexico 0.00 0.00 0.10 0.20 0.30 0.40 0.50 0.60 0.70 0.80 0.90 1.00 intensity (tons of CO2 per 2000 US Dollar)
2005 Differences = 5,300 kWh/yr = $165/capita
Comparison of 3 Gorges to Refrigerator and AC Efficiency Improvements TWh Wholesale (3 Gorges) at 3.6 c/kWh Retail (AC + Ref) at 7.2 c/kWh Value of TWh 三峡电量与电冰箱、空调能效对比 120 7.5 100 If Energy Star Air Conditioners 空调 80 6.0 2005 Stds Air Conditioners 空调 TWH/Year Value (billion $/year) 2000 Stds 60 4.5 If Energy Star 3.0 40 Savings calculated 10 years after standard takes effect. Calculations provided by David Fridley, LBNL 2005 Stds Refrigerators 冰箱 20 1.5 2000 Stds 0 3 Gorges 三峡 Refrigerators 冰箱 3 Gorges 三峡 标准生效后,10年节约电量
Other Energy Strategies , 4% Efficiency, 17% Forestry, 20% Renewable Water Energy, 10% Efficiency, 1% Cleaner Power Smart Growth, Plants, 9% 15% Renewable Clean Cars, Fuels, 2% 28% Strategies for Meeting California’s CO2 Goals in 2020 Total Reductions = 174 Million metric Tons CO2 equivalent
Source: Stabilization Wedges: Pacala and Socolow, Science Vol 305, page 968 Growth = 1.5%/yr