Download

1 / 35
350 likes | 363 Views
Inactive lifestyle. Risk!!. Inactive life style = the same risk as hypertension Inactive life style = the same risk as cholesterol Inactive life style = the same risk as smoking An inactive lifestyle is the same heart risk as hypertension or cholesterol or smoking

E N D
Risk!! • Inactive life style = the same risk as hypertension • Inactive life style = the same risk as cholesterol • Inactive life style = the same risk as smoking • An inactive lifestyle is the same heart risk as hypertension or cholesterol or smoking • Choose exercise and manage your risk correctly • Wellness World for your health • SMS “risk” and your name to 082 4577989 and we will contact you with more information
Harvard Alumni study • This monumental study probably was the turning point that has finally influenced the longstanding dispute between physical activity and coronary heart diseases. • At present, there is no doubt that physical activity is one of the four primary risk factors for heart diseases, ie: • physical inactivity, • smoking, • high cholesterol and • high blood pressure (hypertension).
Relationship between physical activity and morbidity rate as found in the Harvard Alumni study. 100 80 60 40 20 0A Ouderdom-aangepasde Sterftes / 10 000 man-jare < 500 500-999 1000-1499 1500-1999 2000-2499 2500-2999 3000-3499 >3500 Blair & Meridith, 1994 Kilojoules
In this study, the health reports of 1700 students enrolled with Harvard University between 1916 – 1950 were examined. • These students also completed a questionnaire about their lifestyle between 1962 – 1966 and then they were followed up for 16 years. The major causes of death were: • Cardiovascular (45%) • Cancer (32%) • Other natural causes (13%) • Trauma (10%) • From 2.2, it is clear that those who consumed less than 500 k.cal/week showed the highest death rate. • Even ‘n little more activity to the next category (500 – 999) made a big difference. • Participation in physical activity appears to have a salutogenic (healing) effect.
100 80 60 40 20 0 Ouderdom-aangepasde Sterftes / 10 000 man-jare SBD >140 mmHg Cholesterol >260mg/dL Roker Barlow et al, 1990
Age-adjusted deaths • Deaths/10 000 man years • Smoker
Hence it appears that even though a person lives unhealthily but falls in the highly active group, his health status is beter than that of those who are in die healthy group but are physically inactive. • The strong salutogenic (healing) effect of physical activity is clear from this. • This trend is also confirmed by the work of Barlow and his co-workers (1) (Figure 2.6). They prefer to use fitness to divide the group showing coronary risk factors.
This is not just a “potbelly”!! • It is as great a heart risk as hypertension or high cholesterol or smoking! • Choose exercise and manage your risk correctly • Wellness World for your health • SMS “risk \” and your name to 082 457 7989 and we will contact you with more information. The first five persons to SMS will each win a free clinical, physical and fitness evaluation.
● The distribution of body fat is recognised as an important indicator of the health risks of obesity ● Individuals with more fat around the waist, specifically abdominal fat, have a higher risk of : ●hypertension ● type 2 diabetes ● High percentage of fat in the bloodstream ● Coronary arterial disease ● Premature death ● Health risk increases with waist-to-hip ratio ● For young men and ladies, the waist-to-hip ratio posing health risks is from • 0.94 men • 0.82 women ● For ages 60 to 69 years, the waist-to-hip ratio posing health risks is from • 1.03 for men and • 0.90 for women.
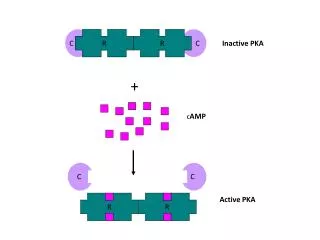
Mechanism by which exercise contributes to the prevention of primary and secondary heart disease
A. Maintenance of increase in myocardial oxygen supply • Retards progression of coronary atherosclerosis • Increases lipoprotein profile ( HDL / LDL) • Increases carbohydrate metabolism (insulin sensitivity) • Reduces platelet aggregation and increases fibrinolysis • Retards adiposity • Increases coronary collateral vascularisation • Increases coronary blood flow (Myocardial perfusion)
B. Reduces myocardial oxygen demand • Reduces basal heart rate • Lowers systolic blood pressure
C. Increases myocardial function • Increased stroke volume • Increased myocardial contra-activity
D. Increases electrical stability of the myocardium • Reduces regional ischemia • Reduces catecholamines in myocardium
Mechanism by which exercise contributes to the primary and secondary prevention of heart disease
A. Maintains or increases myocardial oxygen supply • Delays progression of coronary atherosclerosis • Improves lipoprotein profile( HDL / LDL) • Improves carbohydrate metabolism( (insulin sensitivity) • Decreases platelet aggregation and increases fibrinolysis • Decreases adiposity • Increases coronary collateral vascularization • Increases coronary blood flow (myocardial perfusion)
B. Decreases myocardial oxygen demand • Decreases resting heart rate • Decreases systolic blood pressure
C. Increases myocardial function • Increases stroke volume • Increases myocardial contractility
D. Increases electrical stability of myocardium • Decreases regional ischemia • Decreases catecholamines in myocardium
Guidelines for rate of mass loss • The safe medically accepted mass loss per week is 1% of body weight, ie 1 kg per week if the patient weighs 100 kg. If mass loss is higher than the accepted norm, the risk arises that it is loss of water and muscle (heart muscle) rather than fat loss.