Download
1 / 20
200 likes | 437 Views
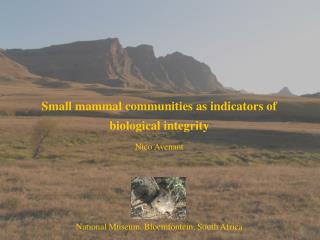
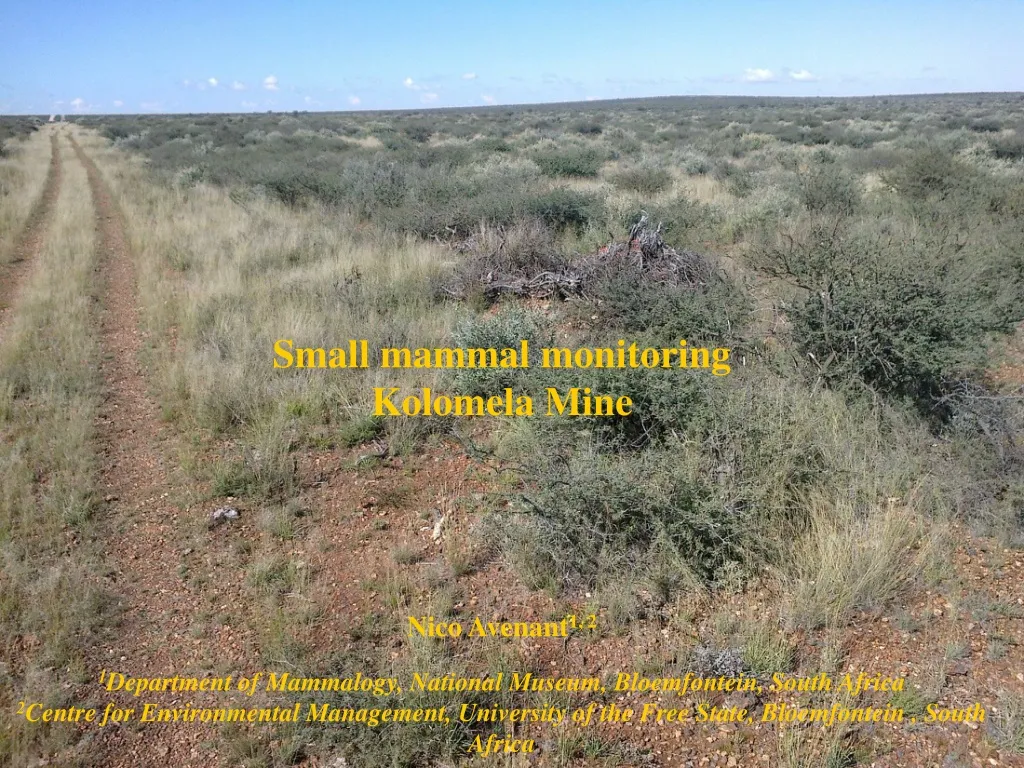
Small mammal monitoring Kolomela Mine Nico Avenant 1, 2 1 Department of Mammalogy, National Museum, Bloemfontein, South Africa 2 Centre for Environmental Management, University of the Free State, Bloemfontein , South Africa.

E N D
Small mammal monitoring Kolomela Mine Nico Avenant1, 2 1Department of Mammalogy, National Museum, Bloemfontein, South Africa 2Centre for Environmental Management, University of the Free State, Bloemfontein, South Africa
Mammal monitoring: - Density - Species richness - Diversity (e.g. Shannon Index) - Relative abundance or evenness (Evar) - Indicator species - Indigenous, Endemic & Alien species - Threatened species - Protected species (e.g. CITES, CMS)
Indicators Top Predator Herbivores Primary producers
Indicators Carnivores
Indigenous vs. ExoticEndemic Indicators Exotic mammals
Food chain: Top predators Number of organisms: c. 66% of mammals species > 300/ha Prey base Biomass:> 10% of total mammalian biomass Secondary users Prey base Ecosystem engineers Primary users Seed dispersers Soil fertilisers Primary producers Growth stimulators
Small mammal sampling are, for a number of reasons, considered to be a relatively easy, quick, inexpensive and effective “tool” in achieving all of these: (1) As primary & secondary users small mammals have an important direct & indirect influence on a number of levels in ecosystems (2) they make out a fairly large percentage of all mammal species(up to >60%). (3) specialized and adapted for survival in “smaller” habitats (than larger mammals) – and are better indicators of ecosystem integrity on the scale that we (e.g. EIA consultants) are working on. (4) they are found in comparatively large numbers (a single species up to 200/ha). Small mammals are, therefore, more available than larger mammals. (5) they contribute largely (> 20%?) of total mammalian biomass and, due to their relatively high metabolism, consume an even larger percentage of total mammalian consumption (6) they are easy to handle, mark and monitor their movement, etc. (7) we know detailed information regarding their biology & natural histories …. (8) they reproduce fast (important if you do removal trapping) (9) are fairly easy to ID(compared to plants & invertebrates) – teach field personnel (10) can sample throughout the year (with vegetation you are often limited to a specific season - e.g. when grasses are in flower/seed/ influorescences still attached (11) due to clear (and easy to observe) reproductive seasons and consequent fluctuations in densities, studies on this important prey group ideal for indicating short term dynamics (connected to e.g. “fat & lean periods”) in an ecosystem.
In literature: Small mammalsrelated to biotic and abiotic variables - habitat structure - habitat complexity - area - productivity - trampling and grazing - surrounding landscape - distance between similar habitats - maturity of the habitat (succession) - presence of exotics / absence of predators.
So, indirectly literature … • changes in small mammal habitats are associated with changes in small mammal diversity • ecological disturbance of these habitats is generally associated with a decrease in small mammal species richness • a connection between the presence or absence of small mammal indicator species and disturbance in natural ecosystems a relatively quick and cheap method of indicating healthy or unhealthy ecosystem functioning?
Specialists Species richness Mystromys albicaudatus Number of species Diversity Generalists Succession Primary productivity
Small mammal survey Standard method Sampled by mark-release trapping • A fixed number of traps (n = 100), are spaced 5 m apart, along a number of transects at each site/plot • Baited with a mixture of peanut butter, rolled oats, sunflower oil and marmite • Left open for 4 consecutive nights and days • Each trap checked at dusk and dawn; rebaited when necessary
7 & 8 1 & 2 11 & 12 9 & 10 3 4 5 6
Specialists Species richness Mystromys albicaudatus Number of species Diversity Generalists Succession Primary productivity