Download
1 / 77
791 likes | 801 Views
The US Federal Budget. <Audience> Month, # 2018 <Your name, Ph.D.>. Na tional Economic Education Delegation. Vision One day, the public discussion of policy issues will be grounded in an accurate perception of the underlying economic principles and data. Mission

E N D
The US Federal Budget <Audience> Month, # 2018 <Your name, Ph.D.>
National Economic Education Delegation • Vision • One day, the public discussion of policy issues will be grounded in an accurate perception of the underlying economic principles and data. • Mission • NEED unites the skills and knowledge of a vast network of professional economists to promote understanding of the economics of policy issues in the United States. • NEED Presentations • Are nonpartisan and intended to reflect the consensus of the economics profession.
Who Are We? • Honorary Board: 44 members • 2 Fed Chairs: Janet Yellen, Ben Bernanke • 6 Chairs Council of Economic Advisers • Furman (D), Rosen (R), Bernanke (R), Yellen (D), Tyson (D), Goolsbee (D) • 3 Nobel Prize Winners • Akerlof, Smith, Maskin • Delegates: 361 members • At all levels of academia and some in government service • All have a Ph.D. in economics • Crowdsource slide decks • Give presentations • Global Partners: 42 Ph.D. Economists • Aid in slide deck development
Credits and Disclaimer • This slide deck was authored by: • Jon Haveman, NEED • This slide deck was reviewed by: • <name>, <affiliation> • <name>, <affiliation> • Disclaimer • NEED presentations are designed to be nonpartisan. • It is, however, inevitable that the presenter will be asked for and will provide their own views. • Such views are those of the presenter and not necessarily those of the National Economic Education Delegation (NEED).
What Does the U.S. Gov’t Budget Look Like? 2018 Budget Summary Budget Deficit: $779 Billion Source: https://www.cbo.gov/publication/53624
Outline • Government Spending • Government Revenues
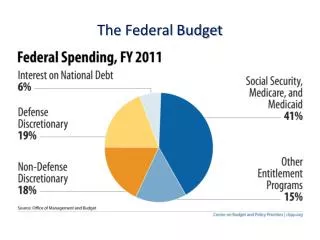
Where Does the Money Go? Source: https://www.nationalpriorities.org/budget-basics/federal-budget-101/
Mandatory Spending: Social Security (24%) • Retirement • Covers 96% of US workers. • Retirement age is increasing from 65-67. • Survivors • A worker's spouse and dependents may be eligible for survivors' benefits if the worker dies. • Disability • A medical condition expected to last at least one year or to be fatal.
Where Do Social Security Funds Come From? • Payroll taxes • Tax rates: • Employee: 6.2% • Employer: 6.2% • Self Employed: 12.4% • Cap in 2019: $132,900 • Taxes on OASDI benefits • Not all benefits are taxed. • Interest earnings Key Question: Who pays?
Social Security Trust Fund • Spending in 2017 • OASI: $807 billion • DI: $146 billion • Income in 2017 • OASI: $826 • DI: $171 • Surplus in 2017 • OASI: $19 • DI: $25 • Total Surplus: $44 Billion
In 2018: Deficits As Far As the Eye Can See Deficits Begin in 2018: Percent of Taxable Payroll • Trust Fund Solvency • Annual deficits after 2017 • Fund insolvent after 2034 SOURCE: 2018 Annual Report of the Board of Trustees of the Federal Old-Age and Survivors Insurance and Disability Insurance Trust Funds, Table IV.B1
Options for Eliminating the Soc Sec Deficits Problem is 1-1.5% of GDP • Raise the retirement age • Increase the tax rate • 4 percentage pt increase raises 0.6% of GDP • Raise the amount of income subject to tax • Tax all wages raises 1.1% of GDP • Reduce benefits • 21% cut in benefits by 2034 would be necessary.
Mandatory Spending: Medicare (14%) • Part A: Hospital Insurance • Part B: Physician, outpatient, home health, and other services. • Part D: Subsidized access to pharmaceuticals. • Part C: Medicare Advantage Plans – offered by private companies approved by Medicare. • Medicare Advantage Plans may offer extra coverage, such as vision, hearing, dental, and/or health and wellness programs.
Where Do Medicare Funds Come From? • Payroll taxes • Tax rates: • Employee: 1.45% • Employer: 1.45% • Self Employed: 2.9% • No Cap • Interest earnings • General revenues • Beneficiary premiums
Medicare Finances in 2018 • Part A: • Income in 2018: $299 billion • Expenses in 2018: $297 billion • Surplus: $2.8 billion • Part B and Part D: • Income in 2018: $406 billion • Expenses in 2018: $414 billion • Surplus: $-7.9 billion • Long term sustainability: • Deficits began in 2016 • For as far as the eye can see • Insolvent in 2026 with current parameters.
Mandatory Spending: Medicaid (9%) • Medicaid provides medical insurance for those whose income and resources are insufficient to pay for health care. • It is a program with costs shared with the states. • Amount spent in 2017: $576.6 Billion • Federal: 61.5% or $354.6 Billion • States: 38.5% $222.0 Billion • People served in 2017: 72 million (22% of Americans)
Mandatory Spending: Income Security (7%) • EITC • SNAP • SSI • TANF • Housing • WIC • School Lunches • Head Start
U.S. Safety Net Expenditures ($ Billions) and Caseload (Millions) – No Medicaid, 2014 or 2015
Mandatory Spending: Interest (8%) • Interest costs in 2018: $325 Billion • 1.6% of GDP, or 8% of the Federal Budget • Forecast to increase to $928 Billion in 2029 • 3.0% of GDP, or 22% of the Federal budget Source: CBO, January 2019 Budget Projections
Mandatory Spending: Other (7%) • Food and agriculture • Veterans’ Benefits • Transportation • Other
What is Discretionary Spending? Int’l Affairs 1%
Mandatory Spending Dominates Forecasts Source: Congressional Budget Office, The Budget and Economic Outlook: 2019 to 2029
Forecast Spending Interest What trends do you see? Other Health Social Security
Aging and Health Care Costs Source: Congressional Budget Office, The Budget and Economic Outlook: 2019 to 2029
Another Category of Spending: Tax Expenditures • Description • Social policies that are implemented and paid for through the tax code. • List of the largest tax breaks: • Mortgage interest deduction - Low tax rates for Capital Gains • Retirement contributions - Child related tax credits • State and local taxes - Charitable gifts • Health insurance - Lifetime Learning • Evidence of who they benefit • Regressive
Tax Expenditures are Significant $1.6 Trillion 200 different categories 7.8% of GDP and more than Discretionary Spending
Important things that people get from govt • Roads and highways • Public education • Defense • Research and development • Space exploration • Income Security • Improved public health • Sanitation • Investments in communications • Energy • Many, many, inventions • Microchips - Touch screens • GPS - Internet • Wind turbines - Bar Codes • Tang - Wii
Federal Government Revenues in 2017 U.S. GDP: $19.5 Trillion Source: https://www.cbo.gov/publication/53627
Where Do Government Revenues Come From? Individual Income Taxes Payroll Taxes Corporate Income Taxes Estate and Gift Taxes Other Customs Duties Excise Taxes Miscellaneous Fees and Fines Federal ReserveRemittances Source: https://www.cbo.gov/publication/53627
Individual Income Taxes • Marginal tax rates • Not all income is subject to the same tax rates • capital gains • Deductions • Talked about as Tax Expenditures
Marginal Tax Rates: Married Filing Jointly • Income is taxed differently at different levels • Individuals are taxed the same way, regardless of overall income: • First dollar is taxed at 10% • 19,401st dollar is taxed at 12% • Millionth dollar is taxed at 37%
Tax Deductions and Exemptions • Exemptions and Deductions • Standard deduction • Personal exemption • Child Tax Credit • Other tax expenditures • E.g., charitable giving, mortgage interest, state and local taxes, and many more. • Refundable Tax Credits • EITC: Earned Income Tax Credit