Download

1 / 19
190 likes | 199 Views
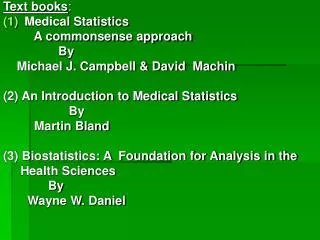
Text books : Medical Statistics A commonsense approach By Michael J. Campbell & David Machin (2) An Introduction to Medical Statistics By Martin Bland (3) Biostatistics: A Foundation for Analysis in the Health Sciences

E N D
Text books: • Medical Statistics A commonsense approach By Michael J. Campbell & David Machin (2) An Introduction to Medical Statistics By Martin Bland (3) Biostatistics: A Foundation for Analysis in the Health Sciences By Wayne W. Daniel
THE CHI-SQUARE TEST BACKGROUND AND NEED OF THE TEST Data collected in the field of medicine is often qualitative. --- For example, the presence or absence of a symptom, classification of pregnancy as ‘high risk’ or ‘non-high risk’, the degree of severity of a disease (mild, moderate, severe)
The measure computed in each instance is a proportion, corresponding to the mean in the case of quantitative data such as height, weight, BMI, serum cholesterol. Comparison between two or more proportions, and the test of significance employed for such purposes is called the “Chi-square test”
---- KARL PEARSON IN 1889, DEVISED AN INDEX OF DISPERSION OR TEST CRITERIOR DENOTED AS “CHI-SQUARE “. (X 2 ). The formula for X 2 –test is,
[ ] S ( o - e) 2 e Chi- Square X 2 = Figure for Each Cell
2 = ∑ ^ total of column in which the cell lies 3. E is the expected frequency (O - E)2 E total of row in which the cell lies reject Ho if 2 > 2.,df where df = (r-1)(c-1) • ^ E = (total of all cells) 1. The summation is over all cells of the contingency table consisting of r rows and c columns 2. O is the observed frequency 4. The degrees of freedom are df = (r-1)(c-1)
APPLICATION OF CHI-SQUARE TEST • TESTING INDEPENDCNE (OR ASSOCATION) • TESTING FOR HOMOGENEITY • TESTING OF GOODNESS-OF-FIT
Chi-square test Purpose To find out whether the association between two categorical variables are statistically significant Null Hypothesis There is no association between two variables
Chi-square test Test statistics 1. 2. 3. 4.
Chi-square test • Objective : Smoking is a risk factor for MI • Null Hypothesis:Smoking does not cause MI
29 21 O O E E 16 34 O O E E Chi-Square MI Non-MI Smoker Non-Smoker
29 21 O O E E 16 34 O O E E Chi-Square MI Non-MI 50 Smoker 50 Non-smoker 45 55 100
^ E = R2C3 n Classification 1 1 2 3 4 c Classification 2 1 R1 2 R2 3 R3 Estimating the Expected Frequencies r Rr ^ (row total for this cell)•(column total for this cell) n E = C1 C2 C3 C4 Cc
21 O E 16 34 O O E E Chi-Square MI Non-MI 50 29 Smoker 50 X 45 100 O 22.5 = 22.5 E 50 Non-smoker 45 55 100
21 O E 16 34 O O E E Chi-Square Alone Others 50 29 Males O 22.5 27.5 E 50 Females 22.5 27.5 45 55 100
Chi-Square • Degrees of Freedomdf = (R-1) (C-1) • Critical Value (Table A.6) = 3.84 • X2 = 6.84
Age Gender <30 30-45 >45 Total Male 60 (60) 20 (30) 40 (30) 120 Female 40 (40) 30 (20) 10 (20) 80 Total 100 50 50 200 Chi- square test Find out whether the sex is equally distributed among each age group
Test for Homogeneity (Similarity) To test similarity between frequency distribution or group. It is used in assessing the similarity between non-responders and responders in any survey