Download
1 / 28
280 likes | 294 Views
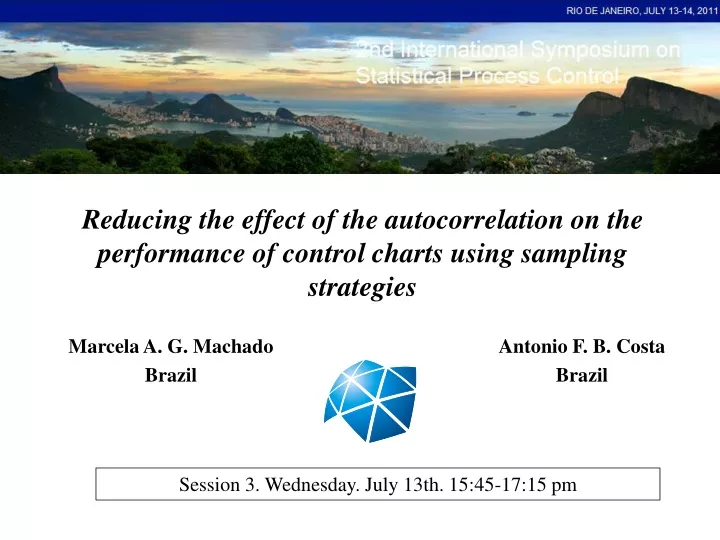
Reducing the effect of the autocorrelation on the performance of control charts using sampling strategies. Marcela A. G. Machado Brazil. Antonio F. B. Costa Brazil. Session 3. Wednesday. July 13th. 15:45-17:15 pm. First-order autoregressive model - AR (1). i =1, 2,. Shewhart model.

E N D
Reducing the effect of the autocorrelation on the performance of control charts using sampling strategies Marcela A. G. Machado Brazil Antonio F. B. Costa Brazil Session 3. Wednesday. July 13th. 15:45-17:15 pm
First-order autoregressive model - AR (1). i=1, 2, ... Shewhart model
Xbar chart 240.00 235.00 230.00 225.00 220.00 215.00 210.00 0 5 10 15 20 Figure 2: Control charts for monitoring the Temperature of a Chemical Bath. Many false alarms (n=3. h=30 minutes) Autocorrelation Figure 1: Temperatures of a Chemical Bath.
19 6 Figure 3: The effect of the autocorrelation on the ARL
References Chen Y.K., Chiou K.C. (2005) Optimal design of VSI Xbar control charts for monitoring correlated samples. Quality and Reliability Engineering International, 21: 757-768. Chen Y.K., Hsieh, K.L, Chang, C.C. (2007) Economic design of the VSSI Xbar control charts for correlated samples. International Journal of Production Economics; 107: 528-539. Costa, A. F. B., Claro, F. A. E. (2008). “Double sampling control Xbar chart for a first-order autoregressive and moving average process model”. The International Journal of Advanced Manufacturing Technology, 39: 521-542. Chau-Chen Torng , Pei-Hsi Lee, Huang-Sheng Liao, Nai-Yi Liao (2009) An economic design of double sampling X charts for correlated data using genetic algorithms Expert Systems with Applications, 36: 12621–12626 Lee, M. H. (2010) Economic Design of Cumulative Sum Control Charts for Monitoring a Process with Correlated Samples Communications in Statistics-Simulation and Computation 39:1909-1922
Case (A) Case (B) Original samples mixed samples 8:30 9:00 9:00 9:30 First strategy to reduce the effect of the autocorrelation
Case (C) 8:00 8:30 9:00
Sample items Skipping two items. Case (E) Time of production Sample items Second strategy to reduce the effect of the autocorrelation Skipping one item. Case (D) Time of production Costa A.F.B., Philippe C. (2011) Effect of measurement error and autocorrelation on the Xbar chart Journal of Applied Statistics, 38: 661-673
X1 X2 Monitoring the mean vector of bivariate processes TheT 2chart 18
Autocorrelated univariate processes – a second model Wandering process mean Shewhart model
25 8 Figure 15: The Xbar chart with wandering mean f=0.4
37 Figure 16: The Xbar chart with wandering mean f=0.8
Table 2: The VP scheme Table 1: The DS scheme Percentage of reduction on the speed with which the Xbar chart signals
REYNOLDS JUNIOR, M. R.; ARNOLD, J. C.; BAIK, J. W. (1996)Variable sampling interval Xbar charts in the presence of correlation. Journal of Quality Technology, v. 28, n. 1, p. 12-29. LU, C. W.; REYNOLDS, M. R. (1999) EWMA control charts for monitoring the mean of autocorrelated processes. Journal of Quality Technology, v. 31, p. 166-188. LU, C. W.; REYNOLDS, M. R. (1999) Control chart for monitoring the mean and variance of autocorrelated processes. Journal of Quality Technology, v. 31, p. 259-274. LU, C. W.; REYNOLDS, M. R. (2001)Cusum charts for monitoring an autocorrelated process. Journal of Quality Technology, v.33, p. 316‑334. LIN, Y. C.; CHOU, C. Y. (2008) The variable sampling rate Xbar control charts for monitoring autocorrelated processes. Quality and Reliability Engineering International, v. 24, p. 855‑870. LIN, Y. C. (2009) The variable parameters control charts for monitoring autocorrelated processes. Communications in Statistics - Simulation and Computation, v. 38, p. 729‑749. COSTA, A. F. B.; MACHADO, M. A. G. (2011)Variable parameter and double sampling Xbar charts in the presence of correlation: the Markov chain approach. International Journal of Production Economics, v. 130, n. 2, p. 224-229.
Conclusions • The autocorrelation reduces the performance of the control charts. • The proposed sampling strategies counteract the undesired effect of the autocorrelation, when the dependence is between the observations. • When the process mean wanders and fandyare large, the marginal gain in the speed with which the Xbar chart signals does not justify the use of the adaptive schemes. • Future investigation: new strategies to improve the performance of the Xbar chart when the process mean wanders.
Acknowledgements This work was supported by: 1) FAPESP – The State of São Paulo Research Foundation 2) CNPq – National Council for Scientific and Technological Development
Thanks a lot for your attention. I would appreciate your suggestions.