Download
1 / 49
510 likes | 1.25k Views
Lecture 9: Protein purification. Protein structure Use tables in book (Voet and Voet) for the properties of peptidases for peptide sequencing Answer key for HW 2 posted.

E N D
Lecture 9: Protein purification • Protein structure • Use tables in book (Voet and Voet) for the properties of peptidases for peptide sequencing • Answer key for HW 2 posted
Figure 6-25 Logarithmic relationship between the molecular mass of a protein and its relative electrophoretic mobility in SDS-PAGE. Page 149
Figure 6-23 Detection of proteins by immunoblotting. Page 148
Isoelectric focusing • For looking at proteins without charge, proteins can be treated with 6M urea (denatures but unlike SDS does not put charges on a protein). • Thus, a mixture of proteins can be electrophoresed through a solution having a a stable pH gradient in from the anode to the cathode and a each protein will migrate to the position in the pH gradient according to its isoelectric point. This is called isoelectric focusing. • Ampholytes (amphoteric electrolytes)-low molecular mass (600-900D) ooligomers with aliphatic amino and carboxylic acid groups with a range of isoelectric points. Ampholytes help maintain the pH gradiennt in the presence of high voltage. • Can also use gels with immobilized pH gradients -made of acrylamide derivatives that are covalently linked to ampholytes. Used with a gradient maker to ensure continuously varied mixture when the gel is made.
Figure 6-26 General formula of the ampholytes used in isoelectric focusing. Page 150
Isoelectric focusing • 2D-gel electrophoresis is an invalubale tool for proteomics. • Proteome (like genome) is the total number of all proteins expressed by a cell or organism, but with an emphasis on their quantitation, localization, modifications, interactions, and activities, as well as their identification. • Individual protein bands froma stained gel can be cut out of a gel, destained, and and the protein can be eluted from the gel fragment for identification and characterization using mass spec.
Figure 6-27 Two-dimensional (2D) gel electrophoresis. Page 150
Table 6-1 Isoelectric Points of Several Common Proteins. Page 133
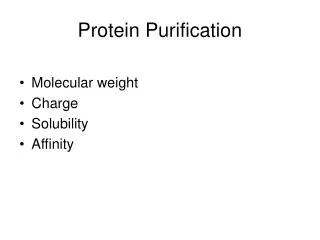
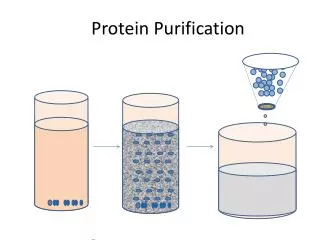
Summary of techniques for protein purification • Cell lysis techniques - osmolysis, mechanical disruption-high speed blender, homogenizer, French press, sonication • Salting out and salting in • Chromatography • Ion exchange • Size exclusion • Affinity • others • Dialysis • Electrophoresis • SDS PAGE • Isoelectric focusing
Crystallization Page 133
Crystallization • Crystallization of proteins-difficult. • Protein must be homogeneous (e.g. pure) • Supersaturated solution prepared (10 mg/ml) and allowed to stand until crystals form. • Use x-ray diffraction to observe the bonds that hold the 3-D shape of the protein.
3-D structure of proteins Single crystal of protein X-ray source Diffraction pattern Computational recombination of scattered x-rays Structural model Electron density map
Figure 8-35 X-Ray diffraction photograph of a single crystal of sperm whale myoglobin.
Molecular Recognition: The ability of molecules to recognize and interact (bind) to specifically with other molecules. • Forces of biological recognition are noncovalent, relatively weak: • (1-30 kJ/mol) vs. 350 kJ/mol for carbon-carbon single bond. • Noncovalent interactions are reversible. • ==>Binding can start and stop within a short timeframe. • Binding between molecules is specific. • ==> Molecules only selectively bind other molecules.
Noncovalent Bonding in Biomolecules • Weaker interactions, termed non-covalent bonds, often control folding, resulting shape and bring biomolecules together for specific purposes. • Ligand (L) + macromolecule (M-protein) • L + M LM
Four types of weak, noncovalent bonds that can be involved in molecular recognition between proteins, nucleic acids and small molecules (e.g., substrates, drugs). Van der Waals forces Ionic bonds (electrostatic forces) Hydrogen bonds Hydrophobic interactions.
Figure 3.1 The Structure of the water molecule showing the relative size of each atom by the Van der Waals radius. • Covalent bonds hold together oxygen and hydrogen atoms. • The polar character, which is the result of electronegativity differences between oxygen and hydrogen, is indicated by the partial charges (d+ and d-) on atoms. (b) Water has a dipole moment because of its bent geometry. The arrows pointing to the more electronegative atom are used to show bond polarity.
Figure 3.2 The CO2 molecule, although composed of polar bonds, has no dipole moment because it is linear. The electronegativity differences between C and O atoms are indicated by the partial charges (d).
Figure 3.3 Hydrogen bond between two water molecules. The hydrogen atom (partially charged) of one water molecule interacts with a lone pair of electrons in an orbital of the oxygen atom of another water molecule.
Figure 3.3 Hydrogen bonds of biological importance: (a) between an alcohol and water or between alcohol molecules; (b) between a carbonyl group and water (X = H, R, OH, OR, or NH2); (c) between two peptide chains, the carbonyl group of one peptide bonds to an N-H of another; (d) between complementary base pairs in DNA.
Figure 3.5 The network of hydrogen bonds in water. (a) The center water molecule may form hydrogen bonds with up to four neighboring molecules, but the average is about three. The network structure is constantly changing, with water molecules undergoing geometrical reorientations and forming new hydrogen bonds with other neighboring water molecules.
Key point: Water has a very high boiling point, freezing point, viscosity, surface tension, and heat capacity relative to other simple non-metallic compounds of similar molecular mass (weight).
Figure 3.6 Chemicals are made soluble in water by (a) dipole-dipole interactions. The partially charged positive atoms (hydrogen) of water and alcohol are attracted to oxygen atom dipoles of water and alcohol. The carbonyl group of an aldehyde, ketone, or acid can also be solvated by water.
Figure 3.6 Chemicals are made soluble in water by (a) dipole-dipole interactions. (b) Ion-dipole interactions. The positively charged sodium ion is surrounded by molecules projecting their partially negative oxygen atoms (dipoles). The acetate ion interacts with the partially positive hydrogen atoms (dipoles) of water.
The highly polar nature of water allows it to break apart (dissolve) ionic interactions that hold together many types of salt crystals (NaCl)
Figure 3.5 The network of hydrogen bonds in water. • A water molecule “wants” to form as many hydrogen bonds possible with its neighbors to lower the net Gibbs free energy of the system. • Typically 3-4 H-bonds possible in solution, transient cluster formation. • The network structure is constantly changing, with water molecules undergoing geometrical reorientations and forming new hydrogen bonds with other neighboring water molecules.
Figure 3.7 The “Hydrophobic Effect” • Because hydrophobic molecules have no polar groups to interact with water, they have to be surrounded by a boundary of water molecules. • The formation of this highly ordered cage of water requires much energy, which comes from hydrophobic interactions.
Water molecules form a highly ordered, low entropy H-bonded “cage” around nonpolar solute molecules
Hydrophobic Interactions • A nonpolar solute "organizes" water. • The H-bond network of water reorganizes to accommodate the nonpolar solute (hydrocarbon). • Fewer H-bonds are formed than desired, H2O molecules must form a “cage” around nonpolar molecules. • This is an increase in "order" of water. • This is a decrease in ENTROPY (S). • Gibbs Free Energy: DG = DH - TDS • A decrease in entropy (-S) results in an increase in Gibbs free energy (+G)!
Figure 3.8 Formation of a micelle from the sodium salt of a long chain carboxylic acid. The nonpolar hydrocarbon tails of the acid arrange themselves to avoid contact with water. The negatively charged carboxyl groups interact with water by forming ion-dipole interactions.
Structural hierarchy in proteins • Primary structure (1º structure)-for a protein is the amino acid sequence of its polypeptide chain(s). • Secondary structure (2º structure)-the local spatial arrangement of a polypeptide’s backbone atoms without regard to the conformations of their side chains. • Tertiary structure (3º structure)-refers to the 3-dimensional structure of an entire polypeptide (close to secondary structure). • Quaternary structure (4º structure)-The spatial arrangement of a protein’s subunits • Most protein is made up of two or more polypeptide chains (subunits) associated through noncovalent interactions.
+ H3N O R2 O R1 O- C C C N C H H H Amide character in the peptide bond • Peptides are rigid due to resonance around the amide bond, having ≈ 40% double-bond character. • This restricts the rotation due to delocalization of electrons and overlap of the O-C-N orbitals.
Figure 8-1 The trans-peptide group. Page 220
Figure 8-2 The cis-peptide group. Page 220
Amide character in the peptide bond • The double bond character results in a planar form around the peptide bond.
Because the backbone of the peptide bond is planar, the backbone conformation can be specified by the torsion angles (rotation angles, dihedral angels) about the C-N bond () and the C-C bond () of each amino acid. • and are both defined as 180º when the polypeptide chain is planar, fully extended (all trans) conformation and increase for a clockwise rotation when viewed from C Page 221
Figure 8-5 Conformations of ethane. Page 221
Figure 8-6 Steric interference between adjacent residues. Page 221
Ramachandran Diagrams • Show the allowed conformations of polypeptides. • These work, because the sterically allowed values of and can be determined by calculating the distances between the atoms at all values and for the central peptide unit. • Sterically forbidden conformations are those in which any nonbonding interatomic distance is less than its corresponding van der Waals distance. • This info can be summarized by the Ramachandran Diagram or Conformation map
Structural properties predicted by Ramachandran Diagram Regions of “normally allowed” torsion angles are shown in blue. Green regions are the “outer limit” regions. Page 222
Table 8-1 van der Waals Distances for Interatomic Contacts. Page 222
+ + H3N H3N COO- COO- C C H H H R Page 223